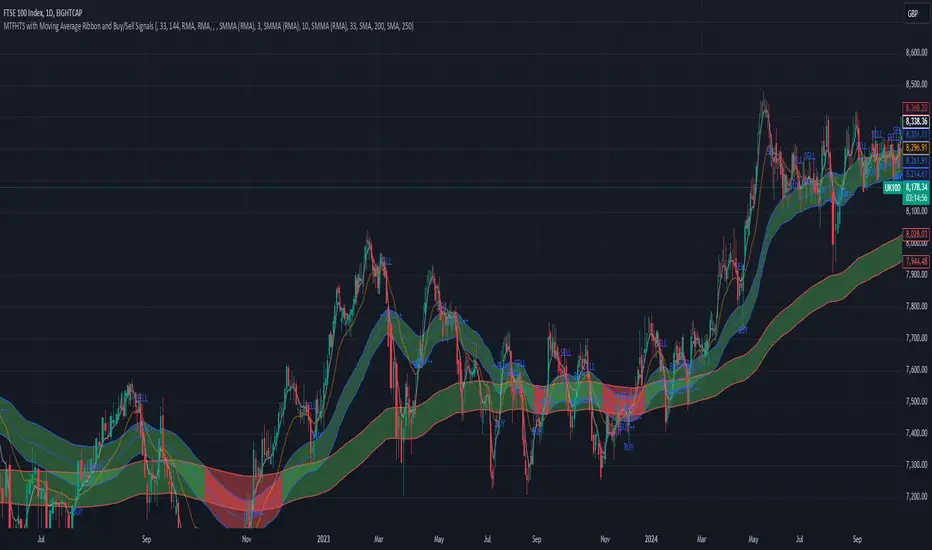
MTFHTS with Moving Average Ribbon and Buy/Sell Signals 3.2Multi-Timeframe Moving Average Strategy with Buy and Sell Signals
Purpose
This strategy is designed to provide clear, data-driven buy and sell signals based on moving average crossovers across multiple timeframes. It aims to help traders identify potential trend reversals and entry/exit points using a systematic approach.
How it Works
Moving Averages Across Multiple Timeframes:
Five customizable moving averages (MA №1 to MA №5) are calculated using different lengths and types, including SMA, EMA, WMA, and VWMA, to suit various trading styles.
The MAs are plotted on different timeframes, allowing traders to visualize trend alignment and identify market momentum across short, medium, and long terms.
Signals for Buying and Selling:
Buy Signals: When the shorter-term MA (MA №1) crosses above a longer-term MA (MA №2 or MA №3), the strategy triggers a buy signal, indicating potential upward momentum.
Sell Signals: When MA №1 crosses below a longer-term MA (MA №2 or MA №3), a sell signal is triggered, suggesting potential downward movement.
Visual Aids and Alerts:
The strategy uses color fills between MAs to indicate bullish (green) or bearish (red) trends, helping traders assess market conditions at a glance.
Alerts for buy and sell signals keep traders notified in real-time, helping to avoid missed opportunities.
Important Note
This strategy is purely educational and does not constitute investment advice. It serves as a tool to help traders understand how multi-timeframe moving averages and crossovers can be used in technical analysis. As with any trading strategy, we recommend testing in a simulated environment and exercising caution.
In den Scripts nach "Buy sell" suchen
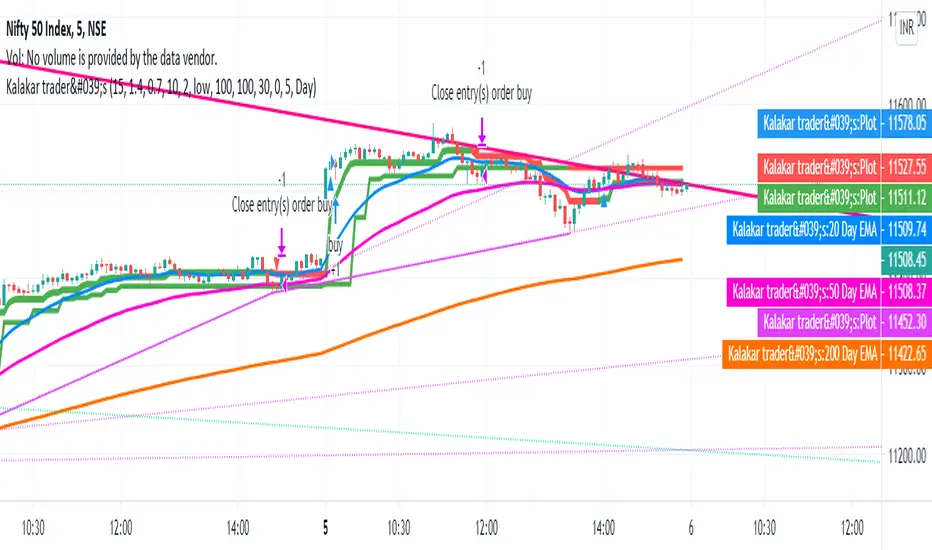
Custom 4 Moving Averages with Styles & ThresholdsThis Pine Script indicator is designed to provide traders with a unique method of analyzing price action through four customizable moving averages, alongside buy and sell threshold detection. The script is fully original and adds value by allowing traders to configure and visualize multiple MAs with different smoothing options, and by detecting critical buy/sell moments based on the interaction between price and the moving averages.
What the Script Does:
Custom Moving Averages: The script plots four distinct moving averages (MA1, MA2, MA3, and MA4) on the chart. Each MA can be configured for length, offset, and optional smoothing to match different trading strategies. This flexibility allows traders to tailor the script for various timeframes, trend detection, and market conditions.
Buy (BT) and Sell (ST) Threshold Detection: The indicator identifies critical points for buying and selling:
Buy Threshold (BT): The script identifies potential buy points when the current candle's low is above the MA2 from the previous candle, suggesting potential upward momentum.
Sell Threshold (ST): It detects potential sell points when the current MA2 falls below the previous candle’s low, indicating possible downward momentum. These thresholds are clearly marked on the chart with green arrows for BT (Buy) and red arrows for ST (Sell).
Horizontal Threshold Lines: Horizontal lines are drawn when BT or ST conditions are met. These lines help traders visualize support and resistance levels, providing clarity in decision-making. The length of these lines is customizable, allowing users to control how long they remain visible on the chart.
Dynamic Cleanup of Old Lines: To keep the chart clean and reduce clutter, the script automatically removes old BT and ST lines after a set period, ensuring that traders can focus on the most relevant data.
Underlying Concepts:
Moving Averages: Moving averages are a fundamental tool in technical analysis for identifying trends. This script uses various moving averages (calculated from high, low, close, and HL2) and allows for smoothing to adjust the sensitivity to price movements. Traders can apply this flexibility to multiple trading styles, from scalping to swing trading.
Threshold Conditions: The buy and sell conditions in this script are based on simple but effective price action patterns, where the interaction between price and MA2 determines entry or exit points. This approach is useful in trend-following strategies, where traders aim to capitalize on momentum shifts.
How to Use the Script:
Configure Moving Averages: Start by adjusting the lengths, offsets, and smoothing options for each moving average. For short-term trading, shorter MA lengths might be more suitable, while longer MAs can help identify broader trends.
Observe Buy and Sell Signals: Look for green arrows (BT) as potential buy signals and red arrows (ST) as potential sell signals. These signals appear when certain conditions between price and MA2 are met, giving traders clear visual cues for entries and exits.
Support/Resistance Levels: Pay attention to the horizontal lines drawn when BT or ST conditions occur. These lines can act as support or resistance levels, helping you identify potential price targets or stop-loss points.
Why This Script is Useful:
This indicator combines the power of multiple moving averages with customizable features, making it versatile for different market conditions. By adding clear buy and sell signals based on a logical threshold system, the script helps traders make informed decisions with minimal guesswork. Unlike many basic indicators, this one provides flexibility and original insight into market dynamics, making it a valuable tool for both beginner and experienced traders.

OrderFlow [Adjustable] | FractalystWhat's the indicator's purpose and functionality?
This indicator is designed to assist traders in identifying real-time probabilities of buyside and sellside liquidity .
It allows for an adjustable pivot level , enabling traders to customize the level they want to use for their entries.
By doing so, traders can evaluate whether their chosen entry point would yield a positive expected value over a large sample size, optimizing their strategy for long-term profitability.
For advanced traders looking to enhance their analysis, the indicator supports the incorporation of up to 7 higher timeframe biases .
Additionally, the higher timeframe pivot level can be adjusted according to the trader's preferences,
Offering maximum adaptability to different strategies and needs, further helping to maximize positive EV.
EV=(P(Win)×R(Win))−(P(Loss)×R(Loss))
-----
What's the purpose of these levels? What are the underlying calculations?
1. Understanding Swing highs and Swing Lows
Swing High: A Swing High is formed when there is a high with 2 lower highs to the left and right.
Swing Low: A Swing Low is formed when there is a low with 2 higher lows to the left and right.
2. Understanding the purpose and the underlying calculations behind Buyside, Sellside and Pivot levels.
3. Identifying Discount and Premium Zones.
4. Importance of Risk-Reward in Premium and Discount Ranges
----
How does the script calculate probabilities?
The script calculates the probability of each liquidity level individually. Here's the breakdown:
1. Upon the formation of a new range, the script waits for the price to reach and tap into pivot level level. Status: "⏸" - Inactive
2. Once pivot level is tapped into, the pivot status becomes activated and it waits for either liquidity side to be hit. Status: "▶" - Active
3. If the buyside liquidity is hit, the script adds to the count of successful buyside liquidity occurrences. Similarly, if the sellside is tapped, it records successful sellside liquidity occurrences.
4. Finally, the number of successful occurrences for each side is divided by the overall count individually to calculate the range probabilities.
Note: The calculations are performed independently for each directional range. A range is considered bearish if the previous breakout was through a sellside liquidity. Conversely, a range is considered bullish if the most recent breakout was through a buyside liquidity.
----
What does the multi-timeframe functionality offer?
In the adjustable version of the orderflow indicator, you can incorporate up to 7 higher timeframe probabilities directly into the table.
This feature allows you to analyze the probabilities of buyside and sellside liquidity across multiple timeframes, without the need to manually switch between them.
By viewing these higher timeframe probabilities in one place, traders can spot larger market trends and refine their entries and exits with a better understanding of the overall market context.
This multi-timeframe functionality helps traders:
1. Simplify decision-making by offering a comprehensive view of multiple timeframes at once.
2. Identify confluence between timeframes, enhancing the confidence in trade setups.
3. Adapt strategies more effectively, as the higher timeframe pivot levels can be customized to meet individual preferences and goals.
----
What are the multi-timeframe underlying calculations?
The script uses the same calculations (mentioned above) and uses security function to request the data such as price levels, bar time, probabilities and booleans from the user-input timeframe.
----
How does the Indicator Identifies Positive Expected Values?
OrderFlow indicator instantly calculates whether a trade setup has the potential for positive expected value (EV) in the long run.
To determine a positive EV setup, the indicator uses the formula:
EV=(P(Win)×R(Win))−(P(Loss)×R(Loss))
where:
P(Win) is the probability of a winning trade.
R(Win) is the reward or return for a winning trade, determined by the current risk-to-reward ratio (RR).
P(Loss) is the probability of a losing trade.
R(Loss) is the loss incurred per losing trade, typically assumed to be -1.
By calculating these values based on historical data and the current trading setup, the indicator helps you understand whether your trade has a positive expected value over a large sample size.
----
How can I know that the setup I'm going to trade with has a postive EV?
If the indicator detects that the adjusted pivot and buy/sell side probabilities have generated positive expected value (EV) in historical data, the risk-to-reward (RR) label within the range box will be colored blue and red .
If the setup does not produce positive EV, the RR label will appear gray.
This indicates that even the risk-to-reward ratio is greater than 1:1, the setup is not likely to yield a positive EV because, according to historical data, the number of losses outweighs the number of wins relative to the RR gain per winning trade.
----
What is the confidence level in the indicator, and how is it determined?
The confidence level in the indicator reflects the reliability of the probabilities calculated based on historical data. It is determined by the sample size of the probabilities used in the calculations. A larger sample size generally increases the confidence level, indicating that the probabilities are more reliable and consistent with past performance.
----
How does the confidence level affect the risk-to-reward (RR) label?
The confidence level (★) is visually represented alongside the probability label. A higher confidence level indicates that the probabilities used to determine the RR label are based on a larger and more reliable sample size.
----
How can traders use the confidence level to make better trading decisions?
Traders can use the confidence level to gauge the reliability of the probabilities and expected value (EV) calculations provided by the indicator. A confidence level above 95% is considered statistically significant and indicates that the historical data supporting the probabilities is robust. This high confidence level suggests that the probabilities are reliable and that the indicator’s recommendations are more likely to be accurate.
In data science and statistics, a confidence level above 95% generally means that there is less than a 5% chance that the observed results are due to random variation. This threshold is widely accepted in research and industry as a marker of statistical significance. Studies such as those published in the Journal of Statistical Software and the American Statistical Association support this threshold, emphasizing that a confidence level above 95% provides a strong assurance of data reliability and validity.
Conversely, a confidence level below 95% indicates that the sample size may be insufficient and that the data might be less reliable . In such cases, traders should approach the indicator’s recommendations with caution and consider additional factors or further analysis before making trading decisions.
----
How does the sample size affect the confidence level, and how does it relate to my TradingView plan?
The sample size for calculating the confidence level is directly influenced by the amount of historical data available on your charts. A larger sample size typically leads to more reliable probabilities and higher confidence levels.
Here’s how the TradingView plans affect your data access:
Essential Plan
The Essential Plan provides basic data access with a limited amount of historical data. This can lead to smaller sample sizes and lower confidence levels, which may weaken the robustness of your probability calculations. Suitable for casual traders who do not require extensive historical analysis.
Plus Plan
The Plus Plan offers more historical data than the Essential Plan, allowing for larger sample sizes and more accurate confidence levels. This enhancement improves the reliability of indicator calculations. This plan is ideal for more active traders looking to refine their strategies with better data.
Premium Plan
The Premium Plan grants access to extensive historical data, enabling the largest sample sizes and the highest confidence levels. This plan provides the most reliable data for accurate calculations, with up to 20,000 historical bars available for analysis. It is designed for serious traders who need comprehensive data for in-depth market analysis.
PRO+ Plans
The PRO+ Plans offer the most extensive historical data, allowing for the largest sample sizes and the highest confidence levels. These plans are tailored for professional traders who require advanced features and significant historical data to support their trading strategies effectively.
For many traders, the Premium Plan offers a good balance of affordability and sufficient sample size for accurate confidence levels.
----
What is the HTF probability table and how does it work?
The HTF (Higher Time Frame) probability table is a feature that allows you to view buy and sellside probabilities and their status from timeframes higher than your current chart timeframe.
Here’s how it works:
Data Request : The table requests and retrieves data from user-defined higher timeframes (HTFs) that you select.
Probability Display: It displays the buy and sellside probabilities for each of these HTFs, providing insights into the likelihood of price movements based on higher timeframe data.
Detailed Tooltips: The table includes detailed tooltips for each timeframe, offering additional context and explanations to help you understand the data better.
----
What do the different colors in the HTF probability table indicate?
The colors in the HTF probability table provide visual cues about the expected value (EV) of trading setups based on higher timeframe probabilities:
Blue: Suggests that entering a long position from the HTF user-defined pivot point, targeting buyside liquidity, is likely to result in a positive expected value (EV) based on historical data and sample size.
Red: Indicates that entering a short position from the HTF user-defined pivot point, targeting sellside liquidity, is likely to result in a positive expected value (EV) based on historical data and sample size.
Gray: Shows that neither long nor short trades from the HTF user-defined pivot point are expected to generate positive EV, suggesting that trading these setups may not be favorable.
----
How to use the indicator effectively?
For Amateur Traders:
Start Simple: Begin by focusing on one timeframe at a time with the pivot level set to the default (50%). This helps you understand the basic functionality of the indicator.
Entry and Exit Strategy: Focus on entering trades at the pivot level while targeting the higher probability side for take profit and the lower probability side for stop loss.
Use simulation or paper trading to practice this strategy.
Adjustments: Once you have a solid understanding of how the indicator works, you can start adjusting the pivot level to other values that suit your strategy.
Ensure that the RR labels are colored (blue or red) to indicate positive EV setups before executing trades.
For Advanced Traders:
1. Select Higher Timeframe Bias: Choose a higher timeframe (HTF) as your main bias. Start with the default pivot level and ensure the confidence level is above 95% to validate the probabilities.
2. Align Lower Timeframes: Switch between lower timeframes to identify which ones align with your predefined HTF bias. This helps in synchronizing your trading decisions across different timeframes.
3. Set Entries with Current Pivot Level: Use the current pivot level for trade entries. Ensure the HTF status label is active, indicating that the probabilities are valid and in play.
4. Target HTF Liquidity Level: Aim for liquidity levels that correspond to the higher timeframe, as these levels are likely to offer better trading opportunities.
5. Adjust Pivot Levels: As you gain experience, adjust the pivot levels to further optimize your strategy for high EV. Fine-tune these levels based on the aggregated data from multiple timeframes.
6. Practice on Paper Trading: Test your strategies through paper trading to eliminate discretion and refine your approach without financial risk.
7. Focus on Trade Management: Ultimately, effective trade management is crucial. Concentrate on managing your trades well to ensure long-term success. By aiming for setups that produce positive EV, you can position yourself similarly to how a casino operates.
----
🎲 Becoming the House (Gaining Edge Over the Market):
In American roulette, the house has a 5.26% edge due to the 0 and 00. This means that while players have a 47.37% chance of winning on even-money bets, the true odds are 50%. The discrepancy between the true odds and the payout ensures that, statistically, the casino will win over time.
From the Trader's Perspective: In trading, you gain an edge by focusing on setups with positive expected value (EV). If you have a 55.48% chance of winning with a 1:1 risk-to-reward ratio, your setup has a higher probability of profitability than the losing side. By consistently targeting such setups and managing your trades effectively, you create a statistical advantage, similar to the casino’s edge.
----
🎰 Applying the Concept to Trading:
Just as casinos rely on their mathematical edge, you can achieve long-term success in trading by focusing on setups with positive EV. By ensuring that your probabilities and risk-to-reward (RR) ratios are in your favor, you create an edge similar to that of the house.
And by systematically targeting trades with favorable probabilities and managing your trades effectively, you improve your chances of profitability over the long run. Which is going to help you “become the house” in your trading, leveraging statistical advantages to enhance your overall performance.
----
What makes this indicator original?
Real-Time Probability Calculations: The indicator provides real-time calculations of buy and sell probabilities based on historical data, allowing traders to assess the likelihood of positive expected value (EV) setups instantly.
Adjustable Pivot Levels: It features an adjustable pivot level that traders can modify according to their preferences, enhancing the flexibility to align with different trading strategies.
Multi-Timeframe Integration: The indicator supports up to 7 higher timeframes, displaying their probabilities and biases in a single view, which helps traders make informed decisions without switching timeframes.
Confidence Levels: It includes confidence levels based on sample sizes, offering insights into the reliability of the probabilities. Traders can gauge the strength of the data before making trades.
Dynamic EV Labels: The indicator provides color-coded EV labels that change based on the validity of the setup. Blue indicates positive EV in a long bias, red indicates positive EV in a short bias and gray signals caution, making it easier for traders to identify high-quality setups.
HTF Probability Table: The HTF probability table displays buy and sell probabilities from user-defined higher timeframes, helping traders integrate broader market context into their decision-making process.
----
Terms and Conditions | Disclaimer
Our charting tools are provided for informational and educational purposes only and should not be construed as financial, investment, or trading advice. They are not intended to forecast market movements or offer specific recommendations. Users should understand that past performance does not guarantee future results and should not base financial decisions solely on historical data.
Built-in components, features, and functionalities of our charting tools are the intellectual property of @Fractalyst use, reproduction, or distribution of these proprietary elements is prohibited.
By continuing to use our charting tools, the user acknowledges and accepts the Terms and Conditions outlined in this legal disclaimer and agrees to respect our intellectual property rights and comply with all applicable laws and regulations.

Pressure Zones with MA [SYNC & TRADE]Description:
The "Pressure Zones with MA " indicator is designed to analyze the pressure of buyers and sellers on the market, as well as to identify areas of increased activity. When designing it, the main task was to see manipulations on the market, when the power of sellers or the power of buyers is in a sideways trend or falling, and the opposite is growing.
Here is a good example. The power of sellers is in a narrow sideways trend, and sales are increasing very aggressively. The power of buyers is in a gray block with the inscription "range". Then we see the fading of the power of sellers and buyers furiously pounce on the asset that has fallen in price.
Here are the main aspects of its operation and use:
First, turn off the moving averages in the indicator settings, on the "style" tab. Choose your favorite asset, which you understand well and know all its ups and downs. I want you to see a clean chart, so that you can be imbued with a new idea, you need to watch it. This is a proprietary indicator and I understand that it does not have the inscription “buy” / “sell”, but believe me, if you pay attention, you will see its strength. I usually add functionality later, but the light code and visualization remain preferable in the first version.
Purpose:
The indicator helps to determine the strength of buyers and sellers in the market.
It visualizes zones where the pressure of buyers or sellers prevails.
Additionally displays moving averages (MA) for data smoothing.
Main components:
Buyer strength chart (blue line)
Seller strength chart (red line)
Moving averages for buyer and seller strength
Threshold line for defining zones
Indicator settings:
Period: defines the base period for calculations (default 89)
Threshold: sets the level for defining pressure zones (from 0 to 2, default 0.8)
MA type for purchases and sales: select the type of moving average (SMA, EMA, RMA, WMA, VWMA, HMA)
MA length for purchases and sales: period for calculating moving averages
Colors for uptrends and downtrends of MA
Moving averages:
Help smooth out data and identify trends
The direction of the MA (up or down) further confirms the current trend
The color of the MA changes depending on the direction (blue for up, red for down)
Now you can turn them on and see how they help in understanding where one or another force is weakening. It is in this case that we see the intersection of forces and the sellers' force is moving aggressively upward. Also, according to the moving average, we see the weakening of the sellers' force. The buyers' force was in the sideways range and then switched on to buy out and also according to the moving average, it is clear where the main interest in purchases disappeared.
Use:
Observe the strength of buyers and sellers relative to each other. They can move simultaneously in one direction, this is regarded as balance
can move in different directions and this will strengthen the upward force of sellers or buyers
You may also notice that the movement of one of the forces will be in a narrow range and the second will grow strongly - this is manipulation or trading without resistance.
You can also play with the threshold line, but it is not the main thing here. I disabled this function in the code.
// Display zones
//bgcolor(buy_zone ? color.new(color.blue, 90) : na)
//bgcolor(sell_zone ? color.new(color.red, 90) : na)
If you want to enable it, copy it instead
// Display zones
bgcolor(buy_zone ? color.new(color.blue, 90) : na)
bgcolor(sell_zone ? color.new(color.red, 90) : na)
Pay attention to the intersection of forces.
Use crossovers of force lines and their moving averages as potential signals
Combine the indicator signals with other technical analysis tools for confirmation
Limitations:
Requires customization of parameters for a specific trading instrument and timeframe
The indicator should not be used as the only tool for making trading decisions
Remember that this indicator provides additional information for market analysis, but is not a guarantee of successful trades. Always combine it with other analysis methods and follow risk management rules.
Описание:
Индикатор "Pressure Zones with MA " предназначен для анализа давления покупателей и продавцов на рынке, а также для определения зон повышенной активности. При его проектировании основная задача была увидеть манипуляции на рынке, когда сила продавцов или сила покупателей стоит в боковике или падает, а противоположная растет.
Вот хороший пример. Сила продавцов стоит в узком боковике, а продажи очень агрессивно усиливаются. Сила покупателей в сером блоке с надписью “range”. Потом мы видим затухание силы продавцов и покупателей яростно накидываются на подешевевший актив.
Вот основные аспекты его работы и использования:
Для начала отключите средние скользящие в настройках индикатора, на закладке “стиль”. Выберите свой любимый актив, в котором вы хорошо разбираетесь и знаете его все взлеты и падения. Я хочу чтобы вы увидели чистый график, для того чтобы вы могли проникнутся новой идеей нужно понаблюдать за ним. Это авторский индикатор и я понимаю что на нем нет надписи “купить” / “продать”, но поверьте уделив свое внимание вы увидите его силу. Я обычно потом добавляю функционал но легкий код и визуализация, в первом варианте остается предпочтительней.
Назначение:
Индикатор помогает определить силу покупателей и продавцов на рынке.
Он визуализирует зоны, где преобладает давление покупателей или продавцов.
Дополнительно отображает скользящие средние (MA) для сглаживания данных.
Основные компоненты:
График силы покупателей (синяя линия)
График силы продавцов (красная линия)
Скользящие средние для силы покупателей и продавцов
Пороговая линия для определения зон
Настройки индикатора:
Период (Period): определяет базовый период для расчетов (по умолчанию 89)
Порог (Threshold): устанавливает уровень для определения зон давления (от 0 до 2, по умолчанию 0.8)
Тип MA для покупок и продаж: выбор типа скользящей средней (SMA, EMA, RMA, WMA, VWMA, HMA)
Длина MA для покупок и продаж: период для расчета скользящих средних
Цвета для восходящего и нисходящего трендов MA
Скользящие средние:
Помогают сглаживать данные и выявлять тренды
Направление MA (вверх или вниз) дополнительно подтверждает текущий тренд
Цвет MA меняется в зависимости от направления (синий для восходящего, красный для нисходящего)
Теперь вы можете их включить и посмотреть как они помогают в понимании где ослабевает та или иная сила. Именно в этом случае мы видим пересечение сил и сила продавцов идет агрессивно вверх. Также по средней скользящей мы видим затухание силы продавцов. Сила покупателей стояла в боковике потом включилась на откуп и также по средней скользящей видно где пропал основной интерес к покупкам.
Использование:
Наблюдайте за силой покупателей и продавцов относительно друг друга. Они могут двигаться одновременно в одном направлении это расценивается как баланс
могут двигаться в разных направлениях и это будет усиливать восходящую силу продавцов или покупателей
также возможно вы заметите что движение одной из силы будет в узком диапазоне а вторая будет сильно расти - это манипуляция или торговля без сопротивления.
Также можете поиграть с пороговой линией, но она совершенно не главная здесь. В коде я отключил эту функцию.
// Display zones
//bgcolor(buy_zone ? color.new(color.blue, 90) : na)
//bgcolor(sell_zone ? color.new(color.red, 90) : na)
Если захотите включить скопируйте вместо нее
// Display zones
bgcolor(buy_zone ? color.new(color.blue, 90) : na)
bgcolor(sell_zone ? color.new(color.red, 90) : na)
Обращайте внимание на пересечение сил.
Используйте пересечения линий силы и их скользящих средних как потенциальные сигналы
Комбинируйте сигналы индикатора с другими инструментами технического анализа для подтверждения
Ограничения:
Требуется настройка параметров под конкретный торговый инструмент и таймфрейм
Не следует использовать индикатор как единственный инструмент для принятия торговых решений
Помните, что этот индикатор предоставляет дополнительную информацию для анализа рынка, но не является гарантией успешных сделок. Всегда сочетайте его с другими методами анализа и соблюдайте правила управления рисками.

WaveTrend With Divs & RSI(STOCH) Divs by WeloTradesWaveTrend with Divergences & RSI(STOCH) Divergences by WeloTrades
Overview
The "WaveTrend With Divergences & RSI(STOCH) Divergences" is an advanced Pine Script™ indicator designed for TradingView, offering a multi-dimensional analysis of market conditions. This script integrates several technical indicators—WaveTrend, Money Flow Index (MFI), RSI, and Stochastic RSI—into a cohesive tool that identifies both regular and hidden divergences across these indicators. These divergences can indicate potential market reversals and provide critical trading opportunities.
This indicator is not just a simple combination of popular tools; it offers extensive customization options, organized data presentation, and valuable trading signals that are easy to interpret. Whether you're a day trader or a long-term investor, this script enhances your ability to make informed decisions.
Originality and Usefulness
The originality of this script lies in its integration and the synergy it creates among the indicators used. Rather than merely combining multiple indicators, this script allows them to work together, enhancing each other's strengths. For example, by identifying divergences across WaveTrend, RSI, and Stochastic RSI simultaneously, the script provides multiple layers of confirmation, which reduces the likelihood of false signals and increases the reliability of trading signals.
The usefulness of this script is apparent in its ability to offer a consolidated view of market dynamics. It not only simplifies the analytical process by combining different indicators but also provides deeper insights through its divergence detection features. This comprehensive approach is designed to help traders identify potential market reversals, confirm trends, and ultimately make more informed trading decisions.
How the Components Work Together
1. Cross-Validation of Signals
WaveTrend: This indicator is primarily used to identify overbought and oversold conditions, as well as potential buy and sell signals. WaveTrend's ability to smooth price data and reduce noise makes it a reliable tool for identifying trend reversals.
RSI & Stochastic RSI: These momentum oscillators are used to measure the speed and change of price movements. While RSI identifies general overbought and oversold conditions, Stochastic RSI offers a more granular view by tracking the RSI’s level relative to its high-low range over a period of time. When these indicators align with WaveTrend signals, it adds a layer of confirmation that enhances the reliability of the signals.
Money Flow Index (MFI): This volume-weighted indicator assesses the inflow and outflow of money in an asset, giving insights into buying and selling pressure. By analyzing the MFI alongside WaveTrend and RSI indicators, the script can cross-validate signals, ensuring that buy or sell signals are supported by actual market volume.
Example Bullish scenario:
When a bullish divergence is detected on the RSI and confirmed by a corresponding bullish signal on the WaveTrend, along with an increasing Money Flow Index, the probability of a successful trade setup increases. This cross-validation minimizes the risk of acting on false signals, which might occur when relying on a single indicator.
Example Bearish scenario:
When a bearish divergence is detected on the RSI and confirmed by a corresponding bearish signal on the WaveTrend, along with an decreasing Money Flow Index, the probability of a successful trade setup increases. This cross-validation minimizes the risk of acting on false signals, which might occur when relying on a single indicator.
2. Divergence Detection and Market Reversals
Regular Divergences: Occur when the price action and an indicator (like RSI or WaveTrend) move in opposite directions. Regular bullish divergence signals a potential upward reversal when the price makes a lower low while the indicator makes a higher low. Conversely, regular bearish divergence suggests a downward reversal when the price makes a higher high, but the indicator makes a lower high.
Hidden Divergences: These occur when the price action and indicator move in the same direction, but with different momentum. Hidden bullish divergence suggests the continuation of an uptrend, while hidden bearish divergence suggests the continuation of a downtrend. By detecting these divergences across multiple indicators, the script identifies potential trend reversals or continuations with greater accuracy.
Example: The script might detect a regular bullish divergence on the WaveTrend while simultaneously identifying a hidden bullish divergence on the RSI. This combination suggests that while a trend reversal is possible, the overall market sentiment remains bullish, providing a nuanced view of the market.
A Regular Bullish Divergence Example:
A Hidden Bullish Divergence Example:
A Regular Bearish Divergence Example:
A Hidden Bearish Divergence Example:
3. Trend Strength and Sentiment Analysis
WaveTrend: Measures the strength and direction of the trend. By identifying the extremes of market sentiment (overbought and oversold levels), WaveTrend provides early signals for potential reversals.
Money Flow Index (MFI): Assesses the underlying sentiment by analyzing the flow of money. A rising MFI during an uptrend confirms strong buying pressure, while a falling MFI during a downtrend confirms selling pressure. This helps traders assess whether a trend is likely to continue or reverse.
RSI & Stochastic RSI: Offer a momentum-based perspective on the trend’s strength. High RSI or Stochastic RSI values indicate that the asset may be overbought, suggesting a potential reversal. Conversely, low values indicate oversold conditions, signaling a possible upward reversal.
Example:
During a strong uptrend, the WaveTrend & RSI's might signal overbought conditions, suggesting caution. If the MFI also shows decreasing buying pressure and the RSI reaches extreme levels, these indicators together suggest that the trend might be weakening, and a reversal could be imminent.
Example:
During a strong downtrend, the WaveTrend & RSI's might signal oversold conditions, suggesting caution. If the MFI also shows increasing buying pressure and the RSI reaches extreme levels, these indicators together suggest that the trend might be weakening, and a reversal could be imminent.
Conclusion
The "WaveTrend With Divergences & RSI(STOCH) Divergences" script offers a powerful, integrated approach to technical analysis by combining trend, momentum, and sentiment indicators into a single tool. Its unique value lies in the cross-validation of signals, the ability to detect divergences, and the comprehensive view it provides of market conditions. By offering traders multiple layers of analysis and customization options, this script is designed to enhance trading decisions, reduce false signals, and provide clearer insights into market dynamics.
WAVETREND
Display of WaveTrend:
Display of WaveTrend Setting:
WaveTrend Indicator Explanation
The WaveTrend indicator helps identify overbought and oversold conditions, as well as potential buy and sell signals. Its flexibility allows traders to adapt it to various strategies, making it a versatile tool in technical analysis.
WaveTrend Input Settings:
WT MA Source: Default: HLC3
What it is: The data source used for calculating the WaveTrend Moving Average.
What it does: Determines the input data to smooth price action and filter noise.
Example: Using HLC3 (average of High, Low, Close) provides a smoother data representation compared to using just the closing price.
Length (WT MA Length): Default: 3
What it is: The period used to calculate the Moving Average.
What it does: Adjusts the sensitivity of the WaveTrend indicator, where shorter lengths respond more quickly to price changes.
Example: A length of 3 is ideal for short-term analysis, providing quick reactions to price movements.
WT Channel Length & Average: Default: WT Channel Length = 9, Average = 12
What it is: Lengths used to calculate the WaveTrend channel and its average.
What it does: Smooths out the WaveTrend further, reducing false signals by averaging over a set period.
Example: Higher values reduce noise and help in identifying more reliable trends.
Channel: Style, Width, and Color:
What it is: Customization options for the WaveTrend channel's appearance.
What it does: Adjusts how the channel is displayed, including line style, width, and color.
Example: Choosing an area style with a distinct color can make the WaveTrend indicator clearly visible on the chart.
WT Buy & Sell Signals:
What it is: Settings to enable and customize buy and sell signals based on WaveTrend.
What it does: Allows for the display of buy/sell signals and customization of their shapes and colors.
When it gives a Buy Signal: Generated when the WaveTrend line crosses below an oversold level and then rises back, indicating a potential upward price movement.
When it gives a Sell Signal: Triggered when the WaveTrend line crosses above an overbought level and then declines, suggesting a possible downward trend.
Example: The script identifies these signals based on mean reversion principles, where prices tend to revert to the mean after reaching extremes. Traders can use these signals to time their entries and exits effectively.
WAVETREND OVERBOUGTH AND OVERSOLD LEVELS
Display of WaveTrend with Overbought & Oversold Levels:
Display of WaveTrend Overbought & Oversold Levels Settings:
WaveTrend Overbought & Oversold Levels Explanation
WT OB & OS Levels: Default: OB Level 1 = 53, OB Level 2 = 60, OS Level 1 = -53, OS Level 2 = -60
What it is: The default overbought and oversold levels used by the WaveTrend indicator to signal potential market reversals.
What it does: When the WaveTrend crosses above the OB levels, it indicates an overbought condition, potentially signaling a reversal or selling opportunity. Conversely, when it crosses below the OS levels, it indicates an oversold condition, potentially signaling a reversal or buying opportunity.
Example: A trader might use these levels to time entry or exit points, such as selling when the WaveTrend crosses into the overbought zone or buying when it crosses into the oversold zone.
Show OB/OS Levels: Default: True
What it is: Toggle options to show or hide the overbought and oversold levels on your chart.
What it does: When enabled, these levels will be visually represented on your chart, helping you to easily identify when the market reaches these critical thresholds.
Example: Displaying these levels can help you quickly see when the WaveTrend is approaching or has crossed into overbought or oversold territory, allowing for more informed trading decisions.
Line Style, Width, and Color for OB/OS Levels:
What it is: Options to customize the appearance of the OB and OS levels on your chart, including line style (solid, dotted, dashed), line width, and color.
What it does: These settings allow you to adjust how prominently these levels are displayed on your chart, which can help you better visualize and respond to overbought or oversold conditions.
Example: Setting a thicker, dashed line in a contrasting color can make these levels stand out more clearly, aiding in quick visual identification.
Example of Use:
Scenario: A trader wants to identify potential selling points when the market is overbought. They set the OB levels at 53 and 60, choosing a solid, red line style to make these levels clear on their chart. As the WaveTrend crosses above 53, they monitor for further price action, and upon crossing 60, they consider initiating a sell order.
WAVETREND DIVERGENCES
Display of WaveTrend Divergence:
Display of WaveTrend Divergence Setting:
WaveTrend Divergence Indicator Explanation
The WaveTrend Divergence feature helps identify potential reversal points in the market by highlighting divergences between the price and the WaveTrend indicator. Divergences can signal a shift in market momentum, indicating a possible trend reversal. This component allows traders to visualize and customize divergence detection on their charts.
WaveTrend Divergence Input Settings:
Potential Reversal Range: Default: 28
What it is: The number of bars to look back when detecting potential tops and bottoms.
What it does: Sets the range for identifying possible reversal points based on historical data.
Example: A setting of 28 looks back across the last 28 bars to find reversal points, offering a balance between responsiveness and reliability.
Reversal Minimum LVL OB & OS: Default: OB = 35, OS = -35
What it is: The minimum overbought and oversold levels required for detecting potential reversals.
What it does: Adjusts the thresholds that trigger a reversal signal based on the WaveTrend indicator.
Example: A higher OB level reduces the sensitivity to overbought conditions, potentially filtering out false reversal signals.
Lookback Bar Left & Right: Default: Left = 10, Right = 1
What it is: The number of bars to the left and right used to confirm a top or bottom.
What it does: Helps determine the position of peaks and troughs in the price action.
Example: A larger left lookback captures more extended price action before the peak, while a smaller right lookback focuses on the immediate past.
Lookback Range Min & Max: Default: Min = 5, Max = 60
What it is: The minimum and maximum range for the lookback period when identifying divergences.
What it does: Fine-tunes the detection of divergences by controlling the range over which the indicator looks back.
Example: A wider range increases the chances of detecting divergences across different market conditions.
R.Div Minimum LVL OB & OS: Default: OB = 53, OS = -53
What it is: The threshold levels for detecting regular divergences.
What it does: Adjusts the sensitivity of the regular divergence detection.
Example: Higher thresholds make the detection more conservative, identifying only stronger divergence signals.
H.Div Minimum LVL OB & OS: Default: OB = 20, OS = -20
What it is: The threshold levels for detecting hidden divergences.
What it does: Similar to regular divergence settings but for hidden divergences, which can indicate potential reversals that are less obvious.
Example: Lower thresholds make the hidden divergence detection more sensitive, capturing subtler market shifts.
Divergence Label Options:
What it is: Options to display and customize labels for regular and hidden divergences.
What it does: Allows users to visually differentiate between regular and hidden divergences using customizable labels and colors.
Example: Using different colors and symbols for regular (R) and hidden (H) divergences makes it easier to interpret signals on the chart.
Text Size and Color:
What it is: Customization options for the size and color of divergence labels.
What it does: Adjusts the readability and visibility of divergence labels on the chart.
Example: Larger text size may be preferred for charts with a lot of data, ensuring divergence labels stand out clearly.
FAST & SLOW MONEY FLOW INDEX
Display of Fast & Slow Money Flow:
Display of Fast & Slow Money Flow Setting:
Fast Money Flow Indicator Explanation
The Fast Money Flow indicator helps traders identify the flow of money into and out of an asset over a shorter time frame. By tracking the volume-weighted average of price movements, it provides insights into buying and selling pressure in the market, which can be crucial for making timely trading decisions.
Fast Money Flow Input Settings:
Fast Money Flow: Length: Default: 9
What it is: The period used for calculating the Fast Money Flow.
What it does: Determines the sensitivity of the Money Flow calculation. A shorter length makes the indicator more responsive to recent price changes, while a longer length provides a smoother signal.
Example: A length of 9 is suitable for traders looking to capture quick shifts in market sentiment over a short period.
Fast MFI Area Multiplier: Default: 5
What it is: A multiplier applied to the Money Flow area calculation.
What it does: Adjusts the size of the Money Flow area on the chart, effectively amplifying or reducing the visual impact of the indicator.
Example: A higher multiplier can make the Money Flow more prominent on the chart, aiding in the quick identification of significant money flow changes.
Y Position (Y Pos): Default: 0
What it is: The vertical position adjustment for the Fast Money Flow plot on the chart.
What it does: Allows you to move the Money Flow plot up or down on the chart to avoid overlap with other indicators.
Example: Adjusting the Y Position can be useful if you have multiple indicators on the chart and need to maintain clarity.
Fast MFI Style, Width, and Color:
What it is: Customization options for how the Fast Money Flow is displayed on the chart.
What it does: Enables you to choose between different plot styles (line or area), set the line width, and select colors for positive and negative money flow.
Example: Using different colors for positive (green) and negative (red) money flow helps to visually distinguish between periods of buying and selling pressure.
Slow Money Flow Indicator Explanation
The Slow Money Flow indicator tracks the flow of money into and out of an asset over a longer time frame. It provides a broader perspective on market sentiment, smoothing out short-term fluctuations and highlighting longer-term trends.
Slow Money Flow Input Settings:
Slow Money Flow: Length: Default: 12
What it is: The period used for calculating the Slow Money Flow.
What it does: A longer period smooths out short-term fluctuations, providing a clearer view of the overall money flow trend.
Example: A length of 12 is often used by traders looking to identify sustained trends rather than short-term volatility.
Slow MFI Area Multiplier: Default: 5
What it is: A multiplier applied to the Slow Money Flow area calculation.
What it does: Adjusts the size of the Money Flow area on the chart, helping to emphasize the indicator’s significance.
Example: Increasing the multiplier can help highlight the Money Flow in markets with less volatile price action.
Y Position (Y Pos): Default: 0
What it is: The vertical position adjustment for the Slow Money Flow plot on the chart.
What it does: Allows for vertical repositioning of the Money Flow plot to maintain chart clarity when used with other indicators.
Example: Adjusting the Y Position ensures that the Slow Money Flow indicator does not overlap with other key indicators on the chart.
Slow MFI Style, Width, and Color:
What it is: Customization options for the visual display of the Slow Money Flow on the chart.
What it does: Allows you to choose the plot style (line or area), set the line width, and select colors to differentiate positive and negative money flow.
Example: Customizing the colors for the Slow Money Flow allows traders to quickly distinguish between buying and selling trends in the market.
RSI
Display of RSI:
Display of RSI Setting:
RSI Indicator Explanation
The Relative Strength Index (RSI) is a momentum oscillator that measures the speed and change of price movements. It is typically used to identify overbought or oversold conditions in the market, providing traders with potential signals for buying or selling.
RSI Input Settings:
RSI Source: Default: Close
What it is: The data source used for calculating the RSI.
What it does: Determines which price data (e.g., close, open) is used in the RSI calculation, affecting how the indicator reflects market conditions.
Example: Using the closing price is standard practice, as it reflects the final agreed-upon price for a given time period.
MA Type (Moving Average Type): Default: SMA
What it is: The type of moving average applied to the RSI for smoothing purposes.
What it does: Changes the smoothing technique of the RSI, impacting how quickly the indicator responds to price movements.
Example: Using an Exponential Moving Average (EMA) will make the RSI more sensitive to recent price changes compared to a Simple Moving Average (SMA).
RSI Length: Default: 14
What it is: The period over which the RSI is calculated.
What it does: Adjusts the sensitivity of the RSI. A shorter length (e.g., 7) makes the RSI more responsive to recent price changes, while a longer length (e.g., 21) smooths out the indicator, reducing the number of signals.
Example: A 14-period RSI is commonly used for identifying overbought and oversold conditions, providing a balance between sensitivity and reliability.
RSI Plot Style, Width, and Color:
What it is: Options to customize the appearance of the RSI line on the chart.
What it does: Allows you to adjust the visual representation of the RSI, including the line width and color.
Example: Setting a thicker line width and a bright color like yellow can make the RSI more visible on the chart, aiding in quick analysis.
Display of RSI with RSI Moving Average:
RSI Moving Average Explanation
The RSI Moving Average adds a smoothing layer to the RSI, helping to filter out noise and provide clearer signals. It is particularly useful for confirming trend strength and identifying potential reversals.
RSI Moving Average Input Settings:
MA Length: Default: 14
What it is: The period over which the Moving Average is calculated on the RSI.
What it does: Adjusts the smoothing of the RSI, helping to reduce false signals and provide a clearer trend indication.
Example: A 14-period moving average on the RSI can smooth out short-term fluctuations, making it easier to spot genuine overbought or oversold conditions.
MA Plot Style, Width, and Color:
What it is: Customization options for how the RSI Moving Average is displayed on the chart.
What it does: Allows you to adjust the line width and color, helping to differentiate the Moving Average from the main RSI line.
Example: Using a contrasting color for the RSI Moving Average (e.g., magenta) can help it stand out against the main RSI line, making it easier to interpret the indicator.
STOCHASTIC RSI
Display of Stochastic RSI:
Display of Stochastic RSI Setting:
Stochastic RSI Indicator Explanation
The Stochastic RSI (Stoch RSI) is a momentum oscillator that measures the level of the RSI relative to its high-low range over a set period of time. It is used to identify overbought and oversold conditions, providing potential buy and sell signals based on momentum shifts.
Stochastic RSI Input Settings:
Stochastic RSI Length: Default: 14
What it is: The period over which the Stochastic RSI is calculated.
What it does: Adjusts the sensitivity of the Stochastic RSI. A shorter length makes the indicator more responsive to recent price changes, while a longer length smooths out the fluctuations, reducing noise.
Example: A length of 14 is commonly used to identify momentum shifts over a medium-term period, providing a balanced view of potential overbought or oversold conditions.
Display of Stochastic RSI %K Line:
Stochastic RSI %K Line Explanation
The %K line in the Stochastic RSI is the main line that tracks the momentum of the RSI over the chosen period. It is the faster-moving component of the Stochastic RSI, often used to identify entry and exit points.
Stochastic RSI %K Input Settings:
%K Length: Default: 3
What it is: The period used for smoothing the %K line of the Stochastic RSI.
What it does: Smoothing the %K line helps reduce noise and provides a clearer signal for potential market reversals.
Example: A smoothing length of 3 is common, offering a balance between responsiveness and noise reduction, making it easier to spot significant momentum shifts.
%K Plot Style, Width, and Color:
What it is: Customization options for the visual representation of the %K line.
What it does: Allows you to adjust the appearance of the %K line on the chart, including line width and color, to fit your visual preferences.
Example: Setting a blue color and a medium width for the %K line makes it stand out clearly on the chart, helping to identify key points of momentum change.
%K Fill Color (Above):
What it is: The fill color that appears above the %K line on the chart.
What it does: Adds visual clarity by shading the area above the %K line, making it easier to interpret the direction and strength of momentum.
Example: Using a light blue fill color above the %K line can help emphasize bullish momentum, making it visually prominent.
Display of Stochastic RSI %D Line:
Stochastic RSI %D Line Explanation
The %D line in the Stochastic RSI is a moving average of the %K line and acts as a signal line. It is slower-moving compared to the %K line and is often used to confirm signals or identify potential reversals when it crosses the %K line.
Stochastic RSI %D Input Settings:
%D Length: Default: 3
What it is: The period used for smoothing the %D line of the Stochastic RSI.
What it does: Smooths out the %D line, making it less sensitive to short-term fluctuations and more reliable for identifying significant market signals.
Example: A length of 3 is often used to provide a smoothed signal line that can help confirm trends or reversals indicated by the %K line.
%D Plot Style, Width, and Color:
What it is: Customization options for the visual representation of the %D line.
What it does: Allows you to adjust the appearance of the %D line on the chart, including line width and color, to match your preferences.
Example: Setting an orange color and a thicker line width for the %D line can help differentiate it from the %K line, making crossover points easier to spot.
%D Fill Color (Below):
What it is: The fill color that appears below the %D line on the chart.
What it does: Adds visual clarity by shading the area below the %D line, making it easier to interpret bearish momentum.
Example: Using a light orange fill color below the %D line can highlight bearish conditions, making it visually easier to identify.
RSI & STOCHASTIC RSI OVERBOUGHT AND OVERSOLD LEVELS
Display of RSI & Stochastic with Overbought & Oversold Levels:
Display of RSI & Stochastic Overbought & Oversold Settings:
RSI & Stochastic Overbought & Oversold Levels Explanation
The Overbought (OB) and Oversold (OS) levels for RSI and Stochastic RSI indicators are key thresholds that help traders identify potential reversal points in the market. These levels are used to determine when an asset is likely overbought or oversold, which can signal a potential trend reversal.
RSI & Stochastic Overbought & Oversold Input Settings:
RSI & Stochastic Level 1 Overbought (OB) & Oversold (OS): Default: OB Level = 170, OS Level = 130
What it is: The first set of thresholds for determining overbought and oversold conditions for both RSI and Stochastic RSI indicators.
What it does: When the RSI or Stochastic RSI crosses above the overbought level, it suggests that the asset might be overbought, potentially signaling a sell opportunity. Conversely, when these indicators drop below the oversold level, it suggests the asset might be oversold, potentially signaling a buy opportunity.
Example: If the RSI crosses above 170, traders might look for signs of a potential trend reversal to the downside, while a cross below 130 might indicate a reversal to the upside.
RSI & Stochastic Level 2 Overbought (OB) & Oversold (OS): Default: OB Level = 180, OS Level = 120
What it is: The second set of thresholds for determining overbought and oversold conditions for both RSI and Stochastic RSI indicators.
What it does: These levels provide an additional set of reference points, allowing traders to differentiate between varying degrees of overbought and oversold conditions, potentially leading to more refined trading decisions.
Example: When the RSI crosses above 180, it might indicate an extreme overbought condition, which could be a stronger signal for a sell, while a cross below 120 might indicate an extreme oversold condition, which could be a stronger signal for a buy.
RSI & Stochastic Overbought (OB) Band Customization:
OB Level 1: Width, Style, and Color:
What it is: Customization options for the visual appearance of the first overbought band on the chart.
What it does: Allows you to set the line width, style (solid, dotted, dashed), and color for the first overbought band, enhancing its visibility on the chart.
Example: A dashed red line with medium width can clearly indicate the first overbought level, helping traders quickly identify when this threshold is crossed.
OB Level 2: Width, Style, and Color:
What it is: Customization options for the visual appearance of the second overbought band on the chart.
What it does: Allows you to set the line width, style, and color for the second overbought band, providing a clear distinction from the first band.
Example: A dashed red line with a slightly thicker width can represent a more significant overbought level, making it easier to differentiate from the first level.
RSI & Stochastic Oversold (OS) Band Customization:
OS Level 1: Width, Style, and Color:
What it is: Customization options for the visual appearance of the first oversold band on the chart.
What it does: Allows you to set the line width, style (solid, dotted, dashed), and color for the first oversold band, making it visually prominent.
Example: A dashed green line with medium width can highlight the first oversold level, helping traders identify potential buying opportunities.
OS Level 2: Width, Style, and Color:
What it is: Customization options for the visual appearance of the second oversold band on the chart.
What it does: Allows you to set the line width, style, and color for the second oversold band, providing an additional visual cue for extreme oversold conditions.
Example: A dashed green line with a thicker width can represent a more significant oversold level, offering a stronger visual cue for potential buying opportunities.
RSI DIVERGENCES
Display of RSI Divergence Labels:
Display of RSI Divergence Settings:
RSI Divergence Lookback Explanation
The RSI Divergence settings allow traders to customize the parameters for detecting divergences between the RSI (Relative Strength Index) and price action. Divergences occur when the price moves in the opposite direction to the RSI, potentially signaling a trend reversal. These settings help refine the accuracy of divergence detection by adjusting the lookback period and range. ( NOTE: This setting only imply to the RSI. This doesn't effect the STOCHASTIC RSI. )
RSI Divergence Lookback Input Settings:
Lookback Left: Default: 10
What it is: The number of bars to look back from the current bar to detect a potential divergence.
What it does: Defines the left-side lookback period for identifying pivot points in the RSI, which are used to spot divergences. A longer lookback period may capture more significant trends but could also miss shorter-term divergences.
Example: A setting of 10 bars means the script will consider pivot points up to 10 bars before the current bar to check for divergence patterns.
Lookback Right: Default: 1
What it is: The number of bars to look forward from the current bar to complete the divergence pattern.
What it does: Defines the right-side lookback period for confirming a potential divergence. This setting helps ensure that the identified divergence is valid by allowing the script to check subsequent bars for confirmation.
Example: A setting of 1 bar means the script will look at the next bar to confirm the divergence pattern, ensuring that the signal is reliable.
Lookback Range Min: Default: 5
What it is: The minimum range of bars required to detect a valid divergence.
What it does: Sets a lower bound on the range of bars considered for divergence detection. A lower minimum range might capture more frequent but possibly less significant divergences.
Example: Setting the minimum range to 5 ensures that only divergences spanning at least 5 bars are considered, filtering out very short-term patterns.
Lookback Range Max: Default: 60
What it is: The maximum range of bars within which a divergence can be detected.
What it does: Sets an upper bound on the range of bars considered for divergence detection. A larger maximum range might capture more significant divergences but could also include less relevant long-term patterns.
Example: Setting the maximum range to 60 bars allows the script to detect divergences over a longer timeframe, capturing more extended divergence patterns that could indicate major trend reversals.
RSI Divergence Explanation
RSI divergences occur when the RSI indicator and price action move in opposite directions, signaling potential trend reversals. This section of the settings allows traders to customize the appearance and detection of both regular and hidden bullish and bearish divergences.
RSI Divergence Input Settings:
R. Bullish Div Label: Default: True
What it is: An option to display labels for regular bullish divergences.
What it does: Enables or disables the visibility of labels that mark regular bullish divergences, where the price makes a lower low while the RSI makes a higher low, indicating a potential upward reversal.
Example: A trader might use this to spot buying opportunities in a downtrend when a bullish divergence suggests the trend may be reversing.
Bullish Label Color, Line Width, and Line Color:
What it is: Settings to customize the appearance of regular bullish divergence labels.
What it does: Allows you to choose the color of the labels, adjust the width of the divergence lines, and select the color for these lines.
Example: Selecting a green label color and a distinct line width makes bullish divergences easily recognizable on your chart.
R. Bearish Div Label: Default: True
What it is: An option to display labels for regular bearish divergences.
What it does: Enables or disables the visibility of labels that mark regular bearish divergences, where the price makes a higher high while the RSI makes a lower high, indicating a potential downward reversal.
Example: A trader might use this to spot selling opportunities in an uptrend when a bearish divergence suggests the trend may be reversing.
Bearish Label Color, Line Width, and Line Color:
What it is: Settings to customize the appearance of regular bearish divergence labels.
What it does: Allows you to choose the color of the labels, adjust the width of the divergence lines, and select the color for these lines.
Example: Choosing a red label color and a specific line width makes bearish divergences clearly stand out on your chart.
H. Bullish Div Label: Default: False
What it is: An option to display labels for hidden bullish divergences.
What it does: Enables or disables the visibility of labels that mark hidden bullish divergences, where the price makes a higher low while the RSI makes a lower low, indicating potential continuation of an uptrend.
Example: A trader might use this to confirm an existing uptrend when a hidden bullish divergence signals continued buying strength.
Hidden Bullish Label Color, Line Width, and Line Color:
What it is: Settings to customize the appearance of hidden bullish divergence labels.
What it does: Allows you to choose the color of the labels, adjust the width of the divergence lines, and select the color for these lines.
Example: A softer green color with a thinner line width might be chosen to subtly indicate hidden bullish divergences, keeping the chart clean while providing useful information.
H. Bearish Div Label: Default: False
What it is: An option to display labels for hidden bearish divergences.
What it does: Enables or disables the visibility of labels that mark hidden bearish divergences, where the price makes a lower high while the RSI makes a higher high, indicating potential continuation of a downtrend.
Example: A trader might use this to confirm an existing downtrend when a hidden bearish divergence signals continued selling pressure.
Hidden Bearish Label Color, Line Width, and Line Color:
What it is: Settings to customize the appearance of hidden bearish divergence labels.
What it does: Allows you to choose the color of the labels, adjust the width of the divergence lines, and select the color for these lines.
Example: A muted red color with a thinner line width might be selected to indicate hidden bearish divergences without overwhelming the chart.
Divergence Text Size and Color: Default: S (Small)
What it is: Settings to adjust the size and color of text labels for RSI divergences.
What it does: Allows you to customize the size and color of text labels that display the divergence information on the chart.
Example: Choosing a small text size with a bright white color can make divergence labels easily readable without taking up too much space on the chart.
STOCHASTIC DIVERGENCES
Display of Stochastic RSI Divergence Labels:
Display of Stochastic RSI Divergence Settings:
Stochastic RSI Divergence Explanation
Stochastic RSI divergences occur when the Stochastic RSI indicator and price action move in opposite directions, signaling potential trend reversals. These settings allow traders to customize the detection and visual representation of both regular and hidden bullish and bearish divergences in the Stochastic RSI.
Stochastic RSI Divergence Input Settings:
R. Bullish Div Label: Default: True
What it is: An option to display labels for regular bullish divergences in the Stochastic RSI.
What it does: Enables or disables the visibility of labels that mark regular bullish divergences, where the price makes a lower low while the Stochastic RSI makes a higher low, indicating a potential upward reversal.
Example: A trader might use this to spot buying opportunities in a downtrend when a bullish divergence in the Stochastic RSI suggests the trend may be reversing.
Bullish Label Color, Line Width, and Line Color:
What it is: Settings to customize the appearance of regular bullish divergence labels in the Stochastic RSI.
What it does: Allows you to choose the color of the labels, adjust the width of the divergence lines, and select the color for these lines.
Example: Selecting a blue label color and a distinct line width makes bullish divergences in the Stochastic RSI easily recognizable on your chart.
R. Bearish Div Label: Default: True
What it is: An option to display labels for regular bearish divergences in the Stochastic RSI.
What it does: Enables or disables the visibility of labels that mark regular bearish divergences, where the price makes a higher high while the Stochastic RSI makes a lower high, indicating a potential downward reversal.
Example: A trader might use this to spot selling opportunities in an uptrend when a bearish divergence in the Stochastic RSI suggests the trend may be reversing.
Bearish Label Color, Line Width, and Line Color:
What it is: Settings to customize the appearance of regular bearish divergence labels in the Stochastic RSI.
What it does: Allows you to choose the color of the labels, adjust the width of the divergence lines, and select the color for these lines.
Example: Choosing an orange label color and a specific line width makes bearish divergences in the Stochastic RSI clearly stand out on your chart.
H. Bullish Div Label: Default: False
What it is: An option to display labels for hidden bullish divergences in the Stochastic RSI.
What it does: Enables or disables the visibility of labels that mark hidden bullish divergences, where the price makes a higher low while the Stochastic RSI makes a lower low, indicating potential continuation of an uptrend.
Example: A trader might use this to confirm an existing uptrend when a hidden bullish divergence in the Stochastic RSI signals continued buying strength.
Hidden Bullish Label Color, Line Width, and Line Color:
What it is: Settings to customize the appearance of hidden bullish divergence labels in the Stochastic RSI.
What it does: Allows you to choose the color of the labels, adjust the width of the divergence lines, and select the color for these lines.
Example: A softer blue color with a thinner line width might be chosen to subtly indicate hidden bullish divergences, keeping the chart clean while providing useful information.
H. Bearish Div Label: Default: False
What it is: An option to display labels for hidden bearish divergences in the Stochastic RSI.
What it does: Enables or disables the visibility of labels that mark hidden bearish divergences, where the price makes a lower high while the Stochastic RSI makes a higher high, indicating potential continuation of a downtrend.
Example: A trader might use this to confirm an existing downtrend when a hidden bearish divergence in the Stochastic RSI signals continued selling pressure.
Hidden Bearish Label Color, Line Width, and Line Color:
What it is: Settings to customize the appearance of hidden bearish divergence labels in the Stochastic RSI.
What it does: Allows you to choose the color of the labels, adjust the width of the divergence lines, and select the color for these lines.
Example: A muted orange color with a thinner line width might be selected to indicate hidden bearish divergences without overwhelming the chart.
Divergence Text Size and Color: Default: S (Small)
What it is: Settings to adjust the size and color of text labels for Stochastic RSI divergences.
What it does: Allows you to customize the size and color of text labels that display the divergence information on the chart.
Example: Choosing a small text size with a bright white color can make divergence labels easily readable without taking up too much space on the chart.
Alert System:
Custom Alerts for Divergences and Reversals:
What it is: The script includes customizable alert conditions to notify you of detected divergences or potential reversals based on WaveTrend, RSI, and Stochastic RSI.
What it does: Helps you stay informed of key market movements without constantly monitoring the charts, enabling timely decisions.
Example: Setting an alert for regular bearish divergence on the WaveTrend could notify you of a potential sell opportunity as soon as it is detected.
How to Use Alerts:
Set up custom alerts in TradingView based on these conditions to be notified of potential trading opportunities. Alerts are triggered when the indicator detects conditions that match the selected criteria, such as divergences or potential reversals.
By following the detailed guidelines and examples above, you can effectively use and customize this powerful indicator to suit your trading strategy.
For further understanding and customization, refer to the input settings within the script and adjust them to match your trading style and preferences.
How Components Work Together
Synergy and Cross-Validation: The indicator combines multiple layers of analysis to validate trading signals. For example, a WaveTrend buy signal that coincides with a bullish divergence in RSI and positive fast money flow is likely to be more reliable than any single indicator’s signal. This cross-validation reduces the likelihood of false signals and enhances decision-making.
Comprehensive Market Analysis: Each component plays a role in analyzing different aspects of the market. WaveTrend focuses on trend strength, Money Flow indicators assess market sentiment, while RSI and Stochastic RSI offer detailed views of price momentum and potential reversals.
Ideal For
Traders who require a reliable, multifaceted tool for detecting market trends and reversals.
Investors seeking a deeper understanding of market dynamics across different timeframes and conditions, whether in forex, equities, or cryptocurrency markets.
This script is designed to provide a comprehensive tool for technical analysis, combining multiple indicators and divergence detection into one versatile and customizable script. It is especially useful for traders who want to monitor various indicators simultaneously and look for convergence or divergence signals across different technical tools.
Acknowledgements
Special thanks to these amazing creators for inspiration and their creations:
I want to thank these amazing creators for creating there amazing indicators , that inspired me and also gave me a head start by making this indicator! Without their amazing indicators it wouldn't be possible!
vumanchu: VuManChu Cipher B Divergences.
MisterMoTa: RSI + Divergences + Alerts .
DevLucem: Plain Stochastic Divergence.
Note
This indicator is designed to be a powerful tool in your trading arsenal. However , it is essential to backtest and adjust the settings according to your trading strategy before applying it to live trading . If you have any questions or need further assistance, feel free to reach out.

AlgoBuilder [Mean-Reversion] | FractalystWhat's the strategy's purpose and functionality?
This strategy is designed for both traders and investors looking to rely and trade based on historical and backtested data using automation.
The main goal is to build profitable mean-reversion strategies that outperform the underlying asset in terms of returns while minimizing drawdown.
For example, as for a benchmark, if the S&P 500 (SPX) has achieved an estimated 10% annual return with a maximum drawdown of -57% over the past 20 years, using this strategy with different entry and exit techniques, users can potentially seek ways to achieve a higher Compound Annual Growth Rate (CAGR) while maintaining a lower maximum drawdown.
Although the strategy can be applied to all markets and timeframes, it is most effective on stocks, indices, future markets, cryptocurrencies, and commodities and JPY currency pairs given their trending behaviors.
In trending market conditions, the strategy employs a combination of moving averages and diverse entry models to identify and capitalize on upward market movements. It integrates market structure-based moving averages and bands mechanisms across different timeframes and provides exit techniques, including percentage-based and risk-reward (RR) based take profit levels.
Additionally, the strategy has also a feature that includes a built-in probability function for traders who want to implement probabilities right into their trading strategies.
Performance summary, weekly, and monthly tables enable quick visualization of performance metrics like net profit, maximum drawdown, profit factor, average trade, average risk-reward ratio (RR), and more.
This aids optimization to meet specific goals and risk tolerance levels effectively.
-----
How does the strategy perform for both investors and traders?
The strategy has two main modes, tailored for different market participants: Traders and Investors.
Trading:
1. Trading:
- Designed for traders looking to capitalize on bullish trending markets.
- Utilizes a percentage risk per trade to manage risk and optimize returns.
- Suitable for active trading with a focus on mean-reversion and risk per trade approach.
◓: Mode | %: Risk percentage per trade
3. Investing:
- Geared towards investors who aim to capitalize on bullish trending markets without using leverage while mitigating the asset's maximum drawdown.
- Utilizes pre-define percentage of the equity to buy, hold, and manage the asset.
- Focuses on long-term growth and capital appreciation by fully investing in the asset during bullish conditions.
- ◓: Mode | %: Risk not applied (In investing mode, the strategy uses 10% of equity to buy the asset)
-----
What's is FRMA? How does the triple bands work? What are the underlying calculations?
Middle Band (FRMA):
The middle band is the core of the FRMA system. It represents the Fractalyst Moving Average, calculated by identifying the most recent external swing highs and lows in the market structure.
By determining these external swing pivot points, which act as significant highs and lows within the market range, the FRMA provides a unique moving average that adapts to market structure changes.
Upper Band:
The upper band shows the average price of the most recent external swing highs.
External swing highs are identified as the highest points between pivot points in the market structure.
This band helps traders identify potential overbought conditions when prices approach or exceed this upper band.
Lower Band:
The lower band shows the average price of the most recent external swing lows.
External swing lows are identified as the lowest points between pivot points in the market structure.
The script utilizes this band to identify potential oversold conditions, triggering entry signals as prices approach or drop below the lower band.
Adjustments Based on User Inputs:
Users can adjust how the upper and lower bands are calculated based on their preferences:
Upper/Lower: This method calculates the average bands using the prices of external swing highs and lows identified in the market.
Percentage Deviation from FRMA: Alternatively, users can opt to calculate the bands based on a percentage deviation from the middle FRMA. This approach provides flexibility to adjust the width of the bands relative to market conditions and volatility.
-----
What's the purpose of using moving averages in this strategy? What are the underlying calculations?
Using moving averages is a widely-used technique to trade with the trend.
The main purpose of using moving averages in this strategy is to filter out bearish price action and to only take trades when the price is trading ABOVE specified moving averages.
The script uses different types of moving averages with user-adjustable timeframes and periods/lengths, allowing traders to try out different variations to maximize strategy performance and minimize drawdowns.
By applying these calculations, the strategy effectively identifies bullish trends and avoids market conditions that are not conducive to profitable trades.
The MA filter allows traders to choose whether they want a specific moving average above or below another one as their entry condition.
This comparison filter can be turned on (>) or off.
For example, you can set the filter so that MA#1 > MA#2, meaning the first moving average must be above the second one before the script looks for entry conditions. This adds an extra layer of trend confirmation, ensuring that trades are only taken in more favorable market conditions.
⍺: MA Period | Σ: MA Timeframe
-----
What entry modes are used in this strategy? What are the underlying calculations?
The strategy by default uses two different techniques for the entry criteria with user-adjustable left and right bars: Breakout and Fractal.
1. Breakout Entries :
- The strategy looks for pivot high points with a default period of 3.
- It stores the most recent high level in a variable.
- When the price crosses above this most recent level, the strategy checks if all conditions are met and the bar is closed before taking the buy entry.
◧: Pivot high left bars period | ◨: Pivot high right bars period
2. Fractal Entries :
- The strategy looks for pivot low points with a default period of 3.
- When a pivot low is detected, the strategy checks if all conditions are met and the bar is closed before taking the buy entry.
◧: Pivot low left bars period | ◨: Pivot low right bars period
2. Hunt Entries :
- The strategy identifies a candle that wicks through the lower FRMA band.
- It waits for the next candle to close above the low of the wick candle.
- When this condition is met and the bar is closed, the strategy takes the buy entry.
By utilizing these entry modes, the strategy aims to capitalize on bullish price movements while ensuring that the necessary conditions are met to validate the entry points.
-----
What type of stop-loss identification method are used in this strategy? What are the underlying calculations?
Initial Stop-Loss:
1. ATR Based:
The Average True Range (ATR) is a method used in technical analysis to measure volatility. It is not used to indicate the direction of price but to measure volatility, especially volatility caused by price gaps or limit moves.
Calculation:
- To calculate the ATR, the True Range (TR) first needs to be identified. The TR takes into account the most current period high/low range as well as the previous period close.
The True Range is the largest of the following:
- Current Period High minus Current Period Low
- Absolute Value of Current Period High minus Previous Period Close
- Absolute Value of Current Period Low minus Previous Period Close
- The ATR is then calculated as the moving average of the TR over a specified period. (The default period is 14).
Example - ATR (14) * 2
⍺: ATR period | Σ: ATR Multiplier
2. ADR Based:
The Average Day Range (ADR) is an indicator that measures the volatility of an asset by showing the average movement of the price between the high and the low over the last several days.
Calculation:
- To calculate the ADR for a particular day:
- Calculate the average of the high prices over a specified number of days.
- Calculate the average of the low prices over the same number of days.
- Find the difference between these average values.
- The default period for calculating the ADR is 14 days. A shorter period may introduce more noise, while a longer period may be slower to react to new market movements.
Example - ADR (20) * 2
⍺: ADR period | Σ: ADR Multiplier
3. PL Based:
This method places the stop-loss at the low of the previous candle.
If the current entry is based on the hunt entry strategy, the stop-loss will be placed at the low of the candle that wicks through the lower FRMA band.
Example:
If the previous candle's low is 100, then the stop-loss will be set at 100.
This method ensures the stop-loss is placed just below the most recent significant low, providing a logical and immediate level for risk management.
Application in Strategy (ATR/ADR):
- The strategy calculates the current bar's ADR/ATR with a user-defined period.
- It then multiplies the ADR/ATR by a user-defined multiplier to determine the initial stop-loss level.
By using these methods, the strategy dynamically adjusts the initial stop-loss based on market volatility, helping to protect against adverse price movements while allowing for enough room for trades to develop.
Each market behaves differently across various timeframes, and it is essential to test different parameters and optimizations to find out which trailing stop-loss method gives you the desired results and performance.
-----
What type of break-even and take profit identification methods are used in this strategy? What are the underlying calculations?
For Break-Even:
Percentage (%) Based:
Moves the initial stop-loss to the entry price when the price reaches a certain percentage above the entry.
Calculation:
Break-even level = Entry Price * (1 + Percentage / 100)
Example:
If the entry price is $100 and the break-even percentage is 5%, the break-even level is $100 * 1.05 = $105.
Risk-to-Reward (RR) Based:
Moves the initial stop-loss to the entry price when the price reaches a certain RR ratio.
Calculation:
Break-even level = Entry Price + (Initial Risk * RR Ratio)
Example:
If the entry price is $100, the initial risk is $10, and the RR ratio is 2, the break-even level is $100 + ($10 * 2) = $120.
FRMA Based:
Moves the stop-loss to break-even when the price hits the FRMA level at which the entry was taken.
Calculation:
Break-even level = FRMA level at the entry
Example:
If the FRMA level at entry is $102, the break-even level is set to $102 when the price reaches $102.
For TP1 (Take Profit 1):
- You can choose to set a take profit level at which your position gets fully closed or 50% if the TP2 boolean is enabled.
- Similar to break-even, you can select either a percentage (%) or risk-to-reward (RR) based take profit level, allowing you to set your TP1 level as a percentage amount above the entry price or based on RR.
For TP2 (Take Profit 2):
- You can choose to set a take profit level at which your position gets fully closed.
- As with break-even and TP1, you can select either a percentage (%) or risk-to-reward (RR) based take profit level, allowing you to set your TP2 level as a percentage amount above the entry price or based on RR.
When Both Percentage (%) Based and RR Based Take Profit Levels Are Off:
The script will adjust the take profit level to the higher FRMA band set within user inputs.
Calculation:
Take profit level = Higher FRMA band length/timeframe specified by the user.
This ensures that when neither percentage-based nor risk-to-reward-based take profit methods are enabled, the strategy defaults to using the higher FRMA band as the take profit level, providing a consistent and structured approach to profit-taking.
For TP1 and TP2, it's specifying the price levels at which the position is partially or fully closed based on the chosen method (percentage or RR) above the entry price.
These calculations are crucial for managing risk and optimizing profitability in the strategy.
⍺: BE/TP type (%/RR) | Σ: how many RR/% above the current price
-----
What's the ADR filter? What does it do? What are the underlying calculations?
The Average Day Range (ADR) measures the volatility of an asset by showing the average movement of the price between the high and the low over the last several days.
The period of the ADR filter used in this strategy is tied to the same period you've used for your initial stop-loss.
Users can define the minimum ADR they want to be met before the script looks for entry conditions.
ADR Bias Filter:
- Compares the current bar ADR with the ADR (Defined by user):
- If the current ADR is higher, it indicates that volatility has increased compared to ADR (DbU).(⬆)
- If the current ADR is lower, it indicates that volatility has decreased compared to ADR (DbU).(⬇)
Calculations:
1. Calculate ADR:
- Average the high prices over the specified period.
- Average the low prices over the same period.
- Find the difference between these average values in %.
2. Current ADR vs. ADR (DbU):
- Calculate the ADR for the current bar.
- Calculate the ADR (DbU).
- Compare the two values to determine if volatility has increased or decreased.
By using the ADR filter, the strategy ensures that trades are only taken in favorable market conditions where volatility meets the user's defined threshold, thus optimizing entry conditions and potentially improving the overall performance of the strategy.
>: Minimum required ADR for entry | %: Current ADR comparison to ADR of 14 days ago.
-----
What's the probability filter? What are the underlying calculations?
The probability filter is designed to enhance trade entries by using buyside liquidity and probability analysis to filter out unfavorable conditions.
This filter helps in identifying optimal entry points where the likelihood of a profitable trade is higher.
Calculations:
1. Understanding Swing highs and Swing Lows
Swing High: A Swing High is formed when there is a high with 2 lower highs to the left and right.
Swing Low: A Swing Low is formed when there is a low with 2 higher lows to the left and right.
2. Understanding the purpose and the underlying calculations behind Buyside, Sellside and Equilibrium levels.
3. Understanding probability calculations
1. Upon the formation of a new range, the script waits for the price to reach and tap into equilibrium or the 50% level. Status: "⏸" - Inactive
2. Once equilibrium is tapped into, the equilibrium status becomes activated and it waits for either liquidity side to be hit. Status: "▶" - Active
3. If the buyside liquidity is hit, the script adds to the count of successful buyside liquidity occurrences. Similarly, if the sellside is tapped, it records successful sellside liquidity occurrences.
5. Finally, the number of successful occurrences for each side is divided by the overall count individually to calculate the range probabilities.
Note: The calculations are performed independently for each directional range. A range is considered bearish if the previous breakout was through a sellside liquidity. Conversely, a range is considered bullish if the most recent breakout was through a buyside liquidity.
Example - BSL > 55%
-----
What's the range length Filter? What are the underlying calculations?
The range length filter identifies the price distance between buyside and sellside liquidity levels in percentage terms. When enabled, the script only looks for entries when the minimum range length is met. This helps ensure that trades are taken in markets with sufficient price movement.
Calculations:
Range Length (%) = ( ( Buyside Level − Sellside Level ) / Current Price ) ×100
Range Bias Identification:
Bullish Bias: The current range price has broken above the previous external swing high.
Bearish Bias: The current range price has broken below the previous external swing low.
Example - Range length filter is enabled | Range must be above 1%
>: Minimum required range length for entry | %: Current range length percentage in a (Bullish/Bearish) range
-----
What's the day filter Filter, what does it do?
The day filter allows users to customize the session time and choose the specific days they want to include in the strategy session. This helps traders tailor their strategies to particular trading sessions or days of the week when they believe the market conditions are more favorable for their trading style.
Customize Session Time:
Users can define the start and end times for the trading session.
This allows the strategy to only consider trades within the specified time window, focusing on periods of higher market activity or preferred trading hours.
Select Days:
Users can select which days of the week to include in the strategy.
This feature is useful for excluding days with historically lower volatility or unfavorable trading conditions (e.g., Mondays or Fridays).
Benefits:
Focus on Optimal Trading Periods:
By customizing session times and days, traders can focus on periods when the market is more likely to present profitable opportunities.
Avoid Unfavorable Conditions:
Excluding specific days or times can help avoid trading during periods of low liquidity or high unpredictability, such as major news events or holidays.
Increased Flexibility: The filter provides increased flexibility, allowing traders to adapt the strategy to their specific needs and preferences.
Example - Day filter | Session Filter
θ: Session time | Exchange time-zone
-----
What tables are available in this script?
Table Type:
- Summary: Provides a general overview, displaying key performance parameters such as Net Profit, Profit Factor, Max Drawdown, Average Trade, Closed Trades and more.
Avg Trade: The sum of money gained or lost by the average trade generated by a strategy. Calculated by dividing the Net Profit by the overall number of closed trades. An important value since it must be large enough to cover the commission and slippage costs of trading the strategy and still bring a profit.
MaxDD: Displays the largest drawdown of losses, i.e., the maximum possible loss that the strategy could have incurred among all of the trades it has made. This value is calculated separately for every bar that the strategy spends with an open position.
Profit Factor: The amount of money a trading strategy made for every unit of money it lost (in the selected currency). This value is calculated by dividing gross profits by gross losses.
Avg RR: This is calculated by dividing the average winning trade by the average losing trade. This field is not a very meaningful value by itself because it does not take into account the ratio of the number of winning vs losing trades, and strategies can have different approaches to profitability. A strategy may trade at every possibility in order to capture many small profits, yet have an average losing trade greater than the average winning trade. The higher this value is, the better, but it should be considered together with the percentage of winning trades and the net profit.
Winrate: The percentage of winning trades generated by a strategy. Calculated by dividing the number of winning trades by the total number of closed trades generated by a strategy. Percent profitable is not a very reliable measure by itself. A strategy could have many small winning trades, making the percent profitable high with a small average winning trade, or a few big winning trades accounting for a low percent profitable and a big average winning trade. Most mean-reversion successful strategies have a percent profitability of 40-80% but are profitable due to risk management control.
BE Trades: Number of break-even trades, excluding commission/slippage.
Losing Trades: The total number of losing trades generated by the strategy.
Winning Trades: The total number of winning trades generated by the strategy.
Total Trades: Total number of taken traders visible your charts.
Net Profit: The overall profit or loss (in the selected currency) achieved by the trading strategy in the test period. The value is the sum of all values from the Profit column (on the List of Trades tab), taking into account the sign.
- Monthly: Displays performance data on a month-by-month basis, allowing users to analyze performance trends over each month.
- Weekly: Displays performance data on a week-by-week basis, helping users to understand weekly performance variations.
- OFF: Hides the performance table.
Profit Color:
- Allows users to set the color for representing profit in the performance table, helping to quickly distinguish profitable periods.
Loss Color:
- Allows users to set the color for representing loss in the performance table, helping to quickly identify loss-making periods.
These customizable tables provide traders with flexible and detailed performance analysis, aiding in better strategy evaluation and optimization.
-----
User-input styles and customizations:
To facilitate studying historical data, all conditions and rules can be applied to your charts. By plotting background colors on your charts, you'll be able to identify what worked and what didn't in certain market conditions.
Please note that all background colors in the style are disabled by default to enhance visualization.
-----
How to Use This Algobuilder to Create a Profitable Edge and System:
Choose Your Strategy mode:
- Decide whether you are creating an investing strategy or a trading strategy.
Select a Market:
- Choose a one-sided market such as stocks, indices, or cryptocurrencies.
Historical Data:
- Ensure the historical data covers at least 10 years of price action for robust backtesting.
Timeframe Selection:
- Choose the timeframe you are comfortable trading with. It is strongly recommended to use a timeframe above 15 minutes to minimize the impact of commissions/slippage on your profits.
Set Commission and Slippage:
- Properly set the commission and slippage in the strategy properties according to your broker or prop firm specifications.
Parameter Optimization:
- Use trial and error to test different parameters until you find the performance results you are looking for in the summary table or, preferably, through deep backtesting using the strategy tester.
Trade Count:
- Ensure the number of trades is 100 or more; the higher, the better for statistical significance.
Positive Average Trade:
- Make sure the average trade value is above zero.
(An important value since it must be large enough to cover the commission and slippage costs of trading the strategy and still bring a profit.)
Performance Metrics:
- Look for a high profit factor, and net profit with minimum drawdown.
- Ideally, aim for a drawdown under 20-30%, depending on your risk tolerance.
Refinement and Optimization:
- Try out different markets and timeframes.
- Continue working on refining your edge using the available filters and components to further optimize your strategy.
Automation:
- Once you’re confident in your strategy, you can use the automation section to connect the algorithm to your broker or prop firm.
- Trade a fully automated and backtested trading strategy, allowing for hands-free execution and management.
-----
What makes this strategy original?
1. Incorporating direct integration of probabilities into the strategy.
2. Utilizing built-in market structure-based moving averages across various timeframes.
4. Offering both investing and trading strategies, facilitating optimization from different perspectives.
5. Automation for efficient execution.
6. Providing a summary table for instant access to key parameters of the strategy.
-----
How to use automation?
For Traders:
1. Ensure the strategy parameters are properly set based on your optimized parameters.
2. Enter your PineConnector License ID in the designated field.
3. Specify the desired risk level.
4. Provide the Metatrader symbol.
5. Check for chart updates to ensure the automation table appears on the top right corner, displaying your License ID, risk, and symbol.
6. Set up an alert with the strategy selected as Condition and the Message as {{strategy.order.alert_message}}.
7. Activate the Webhook URL in the Notifications section, setting it as the official PineConnector webhook address.
8. Double-check all settings on PineConnector to ensure the connection is successful.
9. Create the alert for entry/exit automation.
For Investors:
1. Ensure the strategy parameters are properly set based on your optimized parameters.
2. Choose "Investing" in the user-input settings.
3. Create an alert with a specified name.
4. Customize the notifications tab to receive alerts via email.
5. Buying/selling alerts will be triggered instantly upon entry or exit order execution.
-----
Terms and Conditions | Disclaimer
Our charting tools are provided for informational and educational purposes only and should not be construed as financial, investment, or trading advice. They are not intended to forecast market movements or offer specific recommendations. Users should understand that past performance does not guarantee future results and should not base financial decisions solely on historical data.
Built-in components, features, and functionalities of our charting tools are the intellectual property of @Fractalyst Unauthorized use, reproduction, or distribution of these proprietary elements is prohibited.
By continuing to use our charting tools, the user acknowledges and accepts the Terms and Conditions outlined in this legal disclaimer and agrees to respect our intellectual property rights and comply with all applicable laws and regulations.

Price and Volume Stochastic Divergence [MW]Introduction
This indicator creates signals of interest for entering and exiting long and short positions on equities. It primarily uses up and down trends defined by the change in cumulative volume with some filtering provided by a short period exponential moving average (9 EMA by default).
Settings
Moving Average Period : The moving average over which the cumulative volume delta is calculated. Default: 14
Short Period EMA : The EMA used to represent price action, and is used to generate the EMA Delta line. Default: 27 (3*3*3)
Long Period EMA : The second EMA used to calculate the EMA Delta line. Default: 108 (2*2*3*3*3)
Stochastic K Value : The value used for stochastic curve smoothing. Default: 3
Dot Size : The diameter of the larger indicator. Default: 10
Dot Transparency : The transparency level of the outer ring of the primary BUY/SELL signal. Default: 50 (0 is opaque, 100 is transparent)
Band Distance from 0 to 100 : The upper and lower band distance. Default: 20
Calculations
The cumulative volume delta (CVD) is calculated using candle bodies and wicks. For a red candle, buying volume is calculated by multiplying the volume by the spread percentage of the average of the top and bottom wicks, while Selling Volume is calculated multiplying the volume by the spread percentage of the average of the top and bottom wicks - in addition to the spread percentage of the candle body.
For a green candle, buying volume is calculated by multiplying the volume by the spread percentage of the average of the top and bottom wicks - plus the spread percentage of the candle body - while Selling Volume is calculated using only the spread percentage average of the top and bottom wicks.
Once we have the CVD, we can then perform a stochastic calculation of the CVD value.
stochastic calculation = (current value - lowest value in period) / (highest value in period - lowest value in period)
We’ll do the same stochastic calculation for the short term EMA (27 EMA default) as well as for the difference between the short term and long term EMA.
When the stochastic CVD value is rising from zero and the short term EMA stochastic value equals 100, then it’s a major bullish signal. When the stochastic CVD value is falling from 100 and the short term EMA stochastic value equals 0, then it’s a major bearish signal.
Sometimes, after a bullish or bearish signal, the stochastic CVD will reverse direction triggering a new opposing signal.
How to Interpret
The CVD indicates when there is either more buying than selling or vice versa. A value over 50 for the stochastic CVD curve represents more buying taking place. A value below 50 represents more selling. One might intuitively believe that when there is more buying volume than selling volume that the price would follow suit. This is not always the case.
Most of the time buying volume will precede consistent price movement upwards, and selling volume will precede consistent price movement downwards. When this divergence occurs, the indicator generates a signal. When this divergence begins to fail, and buying or selling volume reverses, then another signal is generated indicating that the buying/selling impulse is headed back into the direction of price action.
These interactions are visually represented on the chart with the coral line that represents CVD, and the yellow line that represents the EMA, or the average price. When the coral line goes up and the yellow line stays down, that’s the BUY signal. When the coral line goes down and the yellow line stays up, that’s the sell signal. When the coral line switches direction, the chart generates another signal showing that volume is moving in a direction that supports the price.
The orange line represents the stochastic representation of the difference between the short EMA (27 by default) and the long EMA (108 by default). EMA differences is a method that can be used to define a trend. When a short term EMA is above a longer term EMA, that may represent a bullish trend. When it is below, that may represent a bearish trend. When all 3 lines are rising or falling in the same direction at the same time, it tends to indicate a movement that has the potential to continue.
Other Usage Notes and Limitations
It's important for traders to be aware of the limitations of any indicator and to use them as part of a broader, well-rounded trading strategy that includes risk management, fundamental analysis, and other tools that can help with reducing false signals, determining trend direction, and providing additional confirmation for a trade decision. Diversifying strategies and not relying solely on one type of indicator or analysis can help mitigate some of these risks.
This indicator can be paired with the MW Volume Impulse indicator if it is desired to see the actual buying and selling cumulative volume deltas. Also, in many cases, the BUY and SELL signals tend to correspond with Keltner Bands (ATR Bands) becoming extended. Lastly, volume weighted average price (VWAP) along with other macro events can impact price and negate signals. To view VWAP lines, you may choose to use the Multi VWAP or Multi VWAP for Gaps indicator to help ensure that the signals you see in this indicator are not being affected by VWAP lines.

Supertrend Advance Pullback StrategyHandbook for the Supertrend Advance Strategy
1. Introduction
Purpose of the Handbook:
The main purpose of this handbook is to serve as a comprehensive guide for traders and investors who are looking to explore and harness the potential of the Supertrend Advance Strategy. In the rapidly changing financial market, having the right tools and strategies at one's disposal is crucial. Whether you're a beginner hoping to dive into the world of trading or a seasoned investor aiming to optimize and diversify your portfolio, this handbook offers the insights and methodologies you need. By the end of this guide, readers should have a clear understanding of how the Supertrend Advance Strategy works, its benefits, potential pitfalls, and practical application in various trading scenarios.
Overview of the Supertrend Advance Pullback Strategy:
At its core, the Supertrend Advance Strategy is an evolution of the popular Supertrend Indicator. Designed to generate buy and sell signals in trending markets, the Supertrend Indicator has been a favorite tool for many traders around the world. The Advance Strategy, however, builds upon this foundation by introducing enhanced mechanisms, filters, and methodologies to increase precision and reduce false signals.
1. Basic Concept:
The Supertrend Advance Strategy relies on a combination of price action and volatility to determine the potential trend direction. By assessing the average true range (ATR) in conjunction with specific price points, this strategy aims to highlight the potential starting and ending points of market trends.
2. Methodology:
Unlike the traditional Supertrend Indicator, which primarily focuses on closing prices and ATR, the Advance Strategy integrates other critical market variables, such as volume, momentum oscillators, and perhaps even fundamental data, to validate its signals. This multidimensional approach ensures that the generated signals are more reliable and are less prone to market noise.
3. Benefits:
One of the main benefits of the Supertrend Advance Strategy is its ability to filter out false breakouts and minor price fluctuations, which can often lead to premature exits or entries in the market. By waiting for a confluence of factors to align, traders using this advanced strategy can increase their chances of entering or exiting trades at optimal points.
4. Practical Applications:
The Supertrend Advance Strategy can be applied across various timeframes, from intraday trading to swing trading and even long-term investment scenarios. Furthermore, its flexible nature allows it to be tailored to different asset classes, be it stocks, commodities, forex, or cryptocurrencies.
In the subsequent sections of this handbook, we will delve deeper into the intricacies of this strategy, offering step-by-step guidelines on its application, case studies, and tips for maximizing its efficacy in the volatile world of trading.
As you journey through this handbook, we encourage you to approach the Supertrend Advance Strategy with an open mind, testing and tweaking it as per your personal trading style and risk appetite. The ultimate goal is not just to provide you with a new tool but to empower you with a holistic strategy that can enhance your trading endeavors.
2. Getting Started
Navigating the financial markets can be a daunting task without the right tools. This section is dedicated to helping you set up the Supertrend Advance Strategy on one of the most popular charting platforms, TradingView. By following the steps below, you'll be able to integrate this strategy into your charts and start leveraging its insights in no time.
Setting up on TradingView:
TradingView is a web-based platform that offers a wide range of charting tools, social networking, and market data. Before you can apply the Supertrend Advance Strategy, you'll first need a TradingView account. If you haven't set one up yet, here's how:
1. Account Creation:
• Visit TradingView's official website.
• Click on the "Join for free" or "Sign up" button.
• Follow the registration process, providing the necessary details and setting up your login credentials.
2. Navigating the Dashboard:
• Once logged in, you'll be taken to your dashboard. Here, you'll see a variety of tools, including watchlists, alerts, and the main charting window.
• To begin charting, type in the name or ticker of the asset you're interested in the search bar at the top.
3. Configuring Chart Settings:
• Before integrating the Supertrend Advance Strategy, familiarize yourself with the chart settings. This can be accessed by clicking the 'gear' icon on the top right of the chart window.
• Adjust the chart type, time intervals, and other display settings to your preference.
Integrating the Strategy into a Chart:
Now that you're set up on TradingView, it's time to integrate the Supertrend Advance Strategy.
1. Accessing the Pine Script Editor:
• Located at the top-center of your screen, you'll find the "Pine Editor" tab. Click on it.
• This is where custom strategies and indicators are scripted or imported.
2. Loading the Supertrend Advance Strategy Script:
• Depending on whether you have the script or need to find it, there are two paths:
• If you have the script: Copy the Supertrend Advance Strategy script, and then paste it into the Pine Editor.
• If searching for the script: Click on the “Indicators” icon (looks like a flame) at the top of your screen, and then type “Supertrend Advance Strategy” in the search bar. If available, it will show up in the list. Simply click to add it to your chart.
3. Applying the Strategy:
• After pasting or selecting the Supertrend Advance Strategy in the Pine Editor, click on the “Add to Chart” button located at the top of the editor. This will overlay the strategy onto your main chart window.
4. Configuring Strategy Settings:
• Once the strategy is on your chart, you'll notice a small settings ('gear') icon next to its name in the top-left of the chart window. Click on this to access settings.
• Here, you can adjust various parameters of the Supertrend Advance Strategy to better fit your trading style or the specific asset you're analyzing.
5. Interpreting Signals:
• With the strategy applied, you'll now see buy/sell signals represented on your chart. Take time to familiarize yourself with how these look and behave over various timeframes and market conditions.
3. Strategy Overview
What is the Supertrend Advance Strategy?
The Supertrend Advance Strategy is a refined version of the classic Supertrend Indicator, which was developed to aid traders in spotting market trends. The strategy utilizes a combination of data points, including average true range (ATR) and price momentum, to generate buy and sell signals.
In essence, the Supertrend Advance Strategy can be visualized as a line that moves with the price. When the price is above the Supertrend line, it indicates an uptrend and suggests a potential buy position. Conversely, when the price is below the Supertrend line, it hints at a downtrend, suggesting a potential selling point.
Strategy Goals and Objectives:
1. Trend Identification: At the core of the Supertrend Advance Strategy is the goal to efficiently and consistently identify prevailing market trends. By recognizing these trends, traders can position themselves to capitalize on price movements in their favor.
2. Reducing Noise: Financial markets are often inundated with 'noise' - short-term price fluctuations that can mislead traders. The Supertrend Advance Strategy aims to filter out this noise, allowing for clearer decision-making.
3. Enhancing Risk Management: With clear buy and sell signals, traders can set more precise stop-loss and take-profit points. This leads to better risk management and potentially improved profitability.
4. Versatility: While primarily used for trend identification, the strategy can be integrated with other technical tools and indicators to create a comprehensive trading system.
Type of Assets/Markets to Apply the Strategy:
1. Equities: The Supertrend Advance Strategy is highly popular among stock traders. Its ability to capture long-term trends makes it particularly useful for those trading individual stocks or equity indices.
2. Forex: Given the 24-hour nature of the Forex market and its propensity for trends, the Supertrend Advance Strategy is a valuable tool for currency traders.
3. Commodities: Whether it's gold, oil, or agricultural products, commodities often move in extended trends. The strategy can help in identifying and capitalizing on these movements.
4. Cryptocurrencies: The volatile nature of cryptocurrencies means they can have pronounced trends. The Supertrend Advance Strategy can aid crypto traders in navigating these often tumultuous waters.
5. Futures & Options: Traders and investors in derivative markets can utilize the strategy to make more informed decisions about contract entries and exits.
It's important to note that while the Supertrend Advance Strategy can be applied across various assets and markets, its effectiveness might vary based on market conditions, timeframe, and the specific characteristics of the asset in question. As always, it's recommended to use the strategy in conjunction with other analytical tools and to backtest its effectiveness in specific scenarios before committing to trades.
4. Input Settings
Understanding and correctly configuring input settings is crucial for optimizing the Supertrend Advance Strategy for any specific market or asset. These settings, when tweaked correctly, can drastically impact the strategy's performance.
Grouping Inputs:
Before diving into individual input settings, it's important to group similar inputs. Grouping can simplify the user interface, making it easier to adjust settings related to a specific function or indicator.
Strategy Choice:
This input allows traders to select from various strategies that incorporate the Supertrend indicator. Options might include "Supertrend with RSI," "Supertrend with MACD," etc. By choosing a strategy, the associated input settings for that strategy become available.
Supertrend Settings:
1. Multiplier: Typically, a default value of 3 is used. This multiplier is used in the ATR calculation. Increasing it makes the Supertrend line further from prices, while decreasing it brings the line closer.
2. Period: The number of bars used in the ATR calculation. A common default is 7.
EMA Settings (Exponential Moving Average):
1. Period: Defines the number of previous bars used to calculate the EMA. Common periods are 9, 21, 50, and 200.
2. Source: Allows traders to choose which price (Open, Close, High, Low) to use in the EMA calculation.
RSI Settings (Relative Strength Index):
1. Length: Determines how many periods are used for RSI calculation. The standard setting is 14.
2. Overbought Level: The threshold at which the asset is considered overbought, typically set at 70.
3. Oversold Level: The threshold at which the asset is considered oversold, often at 30.
MACD Settings (Moving Average Convergence Divergence):
1. Short Period: The shorter EMA, usually set to 12.
2. Long Period: The longer EMA, commonly set to 26.
3. Signal Period: Defines the EMA of the MACD line, typically set at 9.
CCI Settings (Commodity Channel Index):
1. Period: The number of bars used in the CCI calculation, often set to 20.
2. Overbought Level: Typically set at +100, denoting overbought conditions.
3. Oversold Level: Usually set at -100, indicating oversold conditions.
SL/TP Settings (Stop Loss/Take Profit):
1. SL Multiplier: Defines the multiplier for the average true range (ATR) to set the stop loss.
2. TP Multiplier: Defines the multiplier for the average true range (ATR) to set the take profit.
Filtering Conditions:
This section allows traders to set conditions to filter out certain signals. For example, one might only want to take buy signals when the RSI is below 30, ensuring they buy during oversold conditions.
Trade Direction and Backtest Period:
1. Trade Direction: Allows traders to specify whether they want to take long trades, short trades, or both.
2. Backtest Period: Specifies the time range for backtesting the strategy. Traders can choose from options like 'Last 6 months,' 'Last 1 year,' etc.
It's essential to remember that while default settings are provided for many of these tools, optimal settings can vary based on the market, timeframe, and trading style. Always backtest new settings on historical data to gauge their potential efficacy.
5. Understanding Strategy Conditions
Developing an understanding of the conditions set within a trading strategy is essential for traders to maximize its potential. Here, we delve deep into the logic behind these conditions, using the Supertrend Advance Strategy as our focal point.
Basic Logic Behind Conditions:
Every strategy is built around a set of conditions that provide buy or sell signals. The conditions are based on mathematical or statistical methods and are rooted in the study of historical price data. The fundamental idea is to recognize patterns or behaviors that have been profitable in the past and might be profitable in the future.
Buy and Sell Conditions:
1. Buy Conditions: Usually formulated around bullish signals or indicators suggesting upward price momentum.
2. Sell Conditions: Centered on bearish signals or indicators indicating downward price momentum.
Simple Strategy:
The simple strategy could involve using just the Supertrend indicator. Here:
• Buy: When price closes above the Supertrend line.
• Sell: When price closes below the Supertrend line.
Pullback Strategy:
This strategy capitalizes on price retracements:
• Buy: When the price retraces to the Supertrend line after a bullish signal and is supported by another bullish indicator.
• Sell: When the price retraces to the Supertrend line after a bearish signal and is confirmed by another bearish indicator.
Indicators Used:
EMA (Exponential Moving Average):
• Logic: EMA gives more weight to recent prices, making it more responsive to current price movements. A shorter-period EMA crossing above a longer-period EMA can be a bullish sign, while the opposite is bearish.
RSI (Relative Strength Index):
• Logic: RSI measures the magnitude of recent price changes to analyze overbought or oversold conditions. Values above 70 are typically considered overbought, and values below 30 are considered oversold.
MACD (Moving Average Convergence Divergence):
• Logic: MACD assesses the relationship between two EMAs of a security’s price. The MACD line crossing above the signal line can be a bullish signal, while crossing below can be bearish.
CCI (Commodity Channel Index):
• Logic: CCI compares a security's average price change with its average price variation. A CCI value above +100 may mean the price is overbought, while below -100 might signify an oversold condition.
And others...
As the strategy expands or contracts, more indicators might be added or removed. The crucial point is to understand the core logic behind each, ensuring they align with the strategy's objectives.
Logic Behind Each Indicator:
1. EMA: Emphasizes recent price movements; provides dynamic support and resistance levels.
2. RSI: Indicates overbought and oversold conditions based on recent price changes.
3. MACD: Showcases momentum and direction of a trend by comparing two EMAs.
4. CCI: Measures the difference between a security's price change and its average price change.
Understanding strategy conditions is not just about knowing when to buy or sell but also about comprehending the underlying market dynamics that those conditions represent. As you familiarize yourself with each condition and indicator, you'll be better prepared to adapt and evolve with the ever-changing financial markets.
6. Trade Execution and Management
Trade execution and management are crucial aspects of any trading strategy. Efficient execution can significantly impact profitability, while effective management can preserve capital during adverse market conditions. In this section, we'll explore the nuances of position entry, exit strategies, and various Stop Loss (SL) and Take Profit (TP) methodologies within the Supertrend Advance Strategy.
Position Entry:
Effective trade entry revolves around:
1. Timing: Enter at a point where the risk-reward ratio is favorable. This often corresponds to confirmatory signals from multiple indicators.
2. Volume Analysis: Ensure there's adequate volume to support the movement. Volume can validate the strength of a signal.
3. Confirmation: Use multiple indicators or chart patterns to confirm the entry point. For instance, a buy signal from the Supertrend indicator can be confirmed with a bullish MACD crossover.
Position Exit Strategies:
A successful exit strategy will lock in profits and minimize losses. Here are some strategies:
1. Fixed Time Exit: Exiting after a predetermined period.
2. Percentage-based Profit Target: Exiting after a certain percentage gain.
3. Indicator-based Exit: Exiting when an indicator gives an opposing signal.
Percentage-based SL/TP:
• Stop Loss (SL): Set a fixed percentage below the entry price to limit potential losses.
• Example: A 2% SL on an entry at $100 would trigger a sell at $98.
• Take Profit (TP): Set a fixed percentage above the entry price to lock in gains.
• Example: A 5% TP on an entry at $100 would trigger a sell at $105.
Supertrend-based SL/TP:
• Stop Loss (SL): Position the SL at the Supertrend line. If the price breaches this line, it could indicate a trend reversal.
• Take Profit (TP): One could set the TP at a point where the Supertrend line flattens or turns, indicating a possible slowdown in momentum.
Swing high/low-based SL/TP:
• Stop Loss (SL): For a long position, set the SL just below the recent swing low. For a short position, set it just above the recent swing high.
• Take Profit (TP): For a long position, set the TP near a recent swing high or resistance. For a short position, near a swing low or support.
And other methods...
1. Trailing Stop Loss: This dynamic SL adjusts with the price movement, locking in profits as the trade moves in your favor.
2. Multiple Take Profits: Divide the position into segments and set multiple TP levels, securing profits in stages.
3. Opposite Signal Exit: Exit when another reliable indicator gives an opposite signal.
Trade execution and management are as much an art as they are a science. They require a blend of analytical skill, discipline, and intuition. Regularly reviewing and refining your strategies, especially in light of changing market conditions, is crucial to maintaining consistent trading performance.
7. Visual Representations
Visual tools are essential for traders, as they simplify complex data into an easily interpretable format. Properly analyzing and understanding the plots on a chart can provide actionable insights and a more intuitive grasp of market conditions. In this section, we’ll delve into various visual representations used in the Supertrend Advance Strategy and their significance.
Understanding Plots on the Chart:
Charts are the primary visual aids for traders. The arrangement of data points, lines, and colors on them tell a story about the market's past, present, and potential future moves.
1. Data Points: These represent individual price actions over a specific timeframe. For instance, a daily chart will have data points showing the opening, closing, high, and low prices for each day.
2. Colors: Used to indicate the nature of price movement. Commonly, green is used for bullish (upward) moves and red for bearish (downward) moves.
Trend Lines:
Trend lines are straight lines drawn on a chart that connect a series of price points. Their significance:
1. Uptrend Line: Drawn along the lows, representing support. A break below might indicate a trend reversal.
2. Downtrend Line: Drawn along the highs, indicating resistance. A break above might suggest the start of a bullish trend.
Filled Areas:
These represent a range between two values on a chart, usually shaded or colored. For instance:
1. Bollinger Bands: The area between the upper and lower band is filled, giving a visual representation of volatility.
2. Volume Profile: Can show a filled area representing the amount of trading activity at different price levels.
Stop Loss and Take Profit Lines:
These are horizontal lines representing pre-determined exit points for trades.
1. Stop Loss Line: Indicates the level at which a trade will be automatically closed to limit losses. Positioned according to the trader's risk tolerance.
2. Take Profit Line: Denotes the target level to lock in profits. Set according to potential resistance (for long trades) or support (for short trades) or other technical factors.
Trailing Stop Lines:
A trailing stop is a dynamic form of stop loss that moves with the price. On a chart:
1. For Long Trades: Starts below the entry price and moves up with the price but remains static if the price falls, ensuring profits are locked in.
2. For Short Trades: Starts above the entry price and moves down with the price but remains static if the price rises.
Visual representations offer traders a clear, organized view of market dynamics. Familiarity with these tools ensures that traders can quickly and accurately interpret chart data, leading to more informed decision-making. Always ensure that the visual aids used resonate with your trading style and strategy for the best results.
8. Backtesting
Backtesting is a fundamental process in strategy development, enabling traders to evaluate the efficacy of their strategy using historical data. It provides a snapshot of how the strategy would have performed in past market conditions, offering insights into its potential strengths and vulnerabilities. In this section, we'll explore the intricacies of setting up and analyzing backtest results and the caveats one must be aware of.
Setting Up Backtest Period:
1. Duration: Determine the timeframe for the backtest. It should be long enough to capture various market conditions (bullish, bearish, sideways). For instance, if you're testing a daily strategy, consider a period of several years.
2. Data Quality: Ensure the data source is reliable, offering high-resolution and clean data. This is vital to get accurate backtest results.
3. Segmentation: Instead of a continuous period, sometimes it's helpful to backtest over distinct market phases, like a particular bear or bull market, to see how the strategy holds up in different environments.
Analyzing Backtest Results:
1. Performance Metrics: Examine metrics like the total return, annualized return, maximum drawdown, Sharpe ratio, and others to gauge the strategy's efficiency.
2. Win Rate: It's the ratio of winning trades to total trades. A high win rate doesn't always signify a good strategy; it should be evaluated in conjunction with other metrics.
3. Risk/Reward: Understand the average profit versus the average loss per trade. A strategy might have a low win rate but still be profitable if the average gain far exceeds the average loss.
4. Drawdown Analysis: Review the periods of losses the strategy could incur and how long it takes, on average, to recover.
9. Tips and Best Practices
Successful trading requires more than just knowing how a strategy works. It necessitates an understanding of when to apply it, how to adjust it to varying market conditions, and the wisdom to recognize and avoid common pitfalls. This section offers insightful tips and best practices to enhance the application of the Supertrend Advance Strategy.
When to Use the Strategy:
1. Market Conditions: Ideally, employ the Supertrend Advance Strategy during trending market conditions. This strategy thrives when there are clear upward or downward trends. It might be less effective during consolidative or sideways markets.
2. News Events: Be cautious around significant news events, as they can cause extreme volatility. It might be wise to avoid trading immediately before and after high-impact news.
3. Liquidity: Ensure you are trading in assets/markets with sufficient liquidity. High liquidity ensures that the price movements are more reflective of genuine market sentiment and not due to thin volume.
Adjusting Settings for Different Markets/Timeframes:
1. Markets: Each market (stocks, forex, commodities) has its own characteristics. It's essential to adjust the strategy's parameters to align with the market's volatility and liquidity.
2. Timeframes: Shorter timeframes (like 1-minute or 5-minute charts) tend to have more noise. You might need to adjust the settings to filter out false signals. Conversely, for longer timeframes (like daily or weekly charts), you might need to be more responsive to genuine trend changes.
3. Customization: Regularly review and tweak the strategy's settings. Periodic adjustments can ensure the strategy remains optimized for the current market conditions.
10. Frequently Asked Questions (FAQs)
Given the complexities and nuances of the Supertrend Advance Strategy, it's only natural for traders, both new and seasoned, to have questions. This section addresses some of the most commonly asked questions regarding the strategy.
1. What exactly is the Supertrend Advance Strategy?
The Supertrend Advance Strategy is an evolved version of the traditional Supertrend indicator. It's designed to provide clearer buy and sell signals by incorporating additional indicators like EMA, RSI, MACD, CCI, etc. The strategy aims to capitalize on market trends while minimizing false signals.
2. Can I use the Supertrend Advance Strategy for all asset types?
Yes, the strategy can be applied to various asset types like stocks, forex, commodities, and cryptocurrencies. However, it's crucial to adjust the settings accordingly to suit the specific characteristics and volatility of each asset type.
3. Is this strategy suitable for day trading?
Absolutely! The Supertrend Advance Strategy can be adjusted to suit various timeframes, making it versatile for both day trading and long-term trading. Remember to fine-tune the settings to align with the timeframe you're trading on.
4. How do I deal with false signals?
No strategy is immune to false signals. However, by combining the Supertrend with other indicators and adhering to strict risk management protocols, you can minimize the impact of false signals. Always use stop-loss orders and consider filtering trades with additional confirmation signals.
5. Do I need any prior trading experience to use this strategy?
While the Supertrend Advance Strategy is designed to be user-friendly, having a foundational understanding of trading and market analysis can greatly enhance your ability to employ the strategy effectively. If you're a beginner, consider pairing the strategy with further education and practice on demo accounts.
6. How often should I review and adjust the strategy settings?
There's no one-size-fits-all answer. Some traders adjust settings weekly, while others might do it monthly. The key is to remain responsive to changing market conditions. Regular backtesting can give insights into potential required adjustments.
7. Can the Supertrend Advance Strategy be automated?
Yes, many traders use algorithmic trading platforms to automate their strategies, including the Supertrend Advance Strategy. However, always monitor automated systems regularly to ensure they're operating as intended.
8. Are there any markets or conditions where the strategy shouldn't be used?
The strategy might generate more false signals in markets that are consolidative or range-bound. During significant news events or times of unexpected high volatility, it's advisable to tread with caution or stay out of the market.
9. How important is backtesting with this strategy?
Backtesting is crucial as it allows traders to understand how the strategy would have performed in the past, offering insights into potential profitability and areas of improvement. Always backtest any new setting or tweak before applying it to live trades.
10. What if the strategy isn't working for me?
No strategy guarantees consistent profits. If it's not working for you, consider reviewing your settings, seeking expert advice, or complementing the Supertrend Advance Strategy with other analysis methods. Remember, continuous learning and adaptation are the keys to trading success.
Other comments
Value of combining several indicators in this script and how they work together
Diversification of Signals: Just as diversifying an investment portfolio can reduce risk, using multiple indicators can offer varied perspectives on potential price movements. Each indicator can capture a different facet of the market, ensuring that traders are not overly reliant on a single data point.
Confirmation & Reduced False Signals: A common challenge with many indicators is the potential for false signals. By requiring confirmation from multiple indicators before acting, the chances of acting on a false signal can be significantly reduced.
Flexibility Across Market Conditions: Different indicators might perform better under different market conditions. For example, while moving averages might excel in trending markets, oscillators like RSI might be more useful during sideways or range-bound conditions. A mashup strategy can potentially adapt better to varying market scenarios.
Comprehensive Analysis: With multiple indicators, traders can gauge trend strength, momentum, volatility, and potential market reversals all at once, providing a holistic view of the market.
How do the different indicators in the Supertrend Advance Strategy work together?
Supertrend: This is primarily a trend-following indicator. It provides traders with buy and sell signals based on the volatility of the price. When combined with other indicators, it can filter out noise and give more weight to strong, confirmed trends.
EMA (Exponential Moving Average): EMA gives more weight to recent price data. It can be used to identify the direction and strength of a trend. When the price is above the EMA, it's generally considered bullish, and vice versa.
RSI (Relative Strength Index): An oscillator that measures the magnitude of recent price changes to evaluate overbought or oversold conditions. By cross-referencing with other indicators like EMA or MACD, traders can spot potential reversals or confirmations of a trend.
MACD (Moving Average Convergence Divergence): This indicator identifies changes in the strength, direction, momentum, and duration of a trend in a stock's price. When the MACD line crosses above the signal line, it can be a bullish sign, and when it crosses below, it can be bearish. Pairing MACD with Supertrend can provide dual confirmation of a trend.
CCI (Commodity Channel Index): Initially developed for commodities, CCI can indicate overbought or oversold conditions. It can be used in conjunction with other indicators to determine entry and exit points.
In essence, the synergy of these indicators provides a balanced, comprehensive approach to trading. Each indicator offers its unique lens into market conditions, and when they align, it can be a powerful indication of a trading opportunity. This combination not only reduces the potential drawbacks of each individual indicator but leverages their strengths, aiming for more consistent and informed trading decisions.
Backtesting and Default Settings
• This indicator has been optimized to be applied for 1 hour-charts. However, the underlying principles of this strategy are supply and demand in the financial markets and the strategy can be applied to all timeframes. Daytraders can use the 1min- or 5min charts, swing-traders can use the daily charts.
• This strategy has been designed to identify the most promising, highest probability entries and trades for each stock or other financial security.
• The combination of the qualifiers results in a highly selective strategy which only considers the most promising swing-trading entries. As a result, you will normally only find a low number of trades for each stock or other financial security per year in case you apply this strategy for the daily charts. Shorter timeframes will result in a higher number of trades / year.
• Consequently, traders need to apply this strategy for a full watchlist rather than just one financial security.
• Default properties: RSI on (length 14, RSI buy level 50, sell level 50), EMA, RSI, MACD on, type of strategy pullback, SL/TP type: ATR (length 10, factor 3), trade direction both, quantity 5, take profit swing hl 5.1, highest / lowest lookback 2, enable ATR trail (ATR length 10, SL ATR multiplier 1.4, TP multiplier 2.1, lookback = 4, trade direction = both).

Heeger Alert | Didi's Needles setup [HeegerBot]Indicator based on Color Candles - Didi's Needles setup , but now exclusively focused on generating alerts.
With this indicator, you can set up alerts and notifications on TradingView for up to 15 assets based on Didi Aguiar's setup. Additionally, you can specify whether the alert should trigger at the candle close or X minutes before the close.
A session filter has also been added, allowing you to configure alerts to trigger only during a specific session.
Description of monitored signals:
The setup involves the crossing of three moving averages, along with the trend analysis in the ADX and the open Bollinger Bands.
The moving averages will be named "Didi Index". We will have the 3-period average as "Fast Average", the 8-period average as "Median Average", and the 20-period average as "Slow Average". When the Fast Average crosses the Median Average, we will have an alert, and when the Slow Average crosses the Median Average, we will have a confirmation. To adjust the Didi Index in the signals, the Median Average was normalized, that is, it will always be equal to 0. For the Slow and Fast Average, we will only consider the percentage difference in relation to the Median Average.
In addition to the moving averages, we analyze whether the ADX is rising, with DI+ above DI- to indicate an uptrend, or if the ADX is rising, with DI- above DI+ to indicate a downtrend. We also check if the Bollinger Bands are open. With these conditions, we will have a Needle.
Now I'm going to detail how I set this up on the indicator and some filters that I inserted for my personal use, along with some additional signals from the setup.
# Needle Alert
Firstly, we have the "Needle Alert" signal. This signal occurs when the Fast Average crosses the Median Average, along with the trend confirmation in the ADX and the opening of the Bollinger Bands. The filter is set at "1", which means we will only consider the needle alert when the percentage difference between the Slow Average and the Median Average is below 1%. This signal can be used as an entry point or to monitor the asset. Let's go through the examples:
• For a "Buy Alert", the Fast Average must cross the Median Average from bottom to top, and the percentage difference between the Slow Average and the Median Average should be less than +1% and greater than 0, as indicated by the Didi Index.
• For a "Sell Alert", the Fast Average must cross the Median Average from top to bottom, and the percentage difference between the Slow Average and the Median Average should be greater than -1% and less than 0, as indicated by the Didi Index.
We also have the alert projection, which serves as a signal to attract attention and monitor the asset. I use a "0.1" filter, which means that the percentage difference between the Fast Average and the Median Average must be equal to or less than 0.1%. Let's look at the example:
• For a "Buy Alert Projection", the Fast Average should be below the Median Average, and the percentage difference between the Fast Average and the Median Average should be greater than -0.1% and less than 0. In addition, the Slow Average should be above the Median Average in the Didi Index.
• For a "Buy Alert Projection", the Fast Average should be below the Median Average, and the percentage difference between the Fast Average and the Median Average should be greater than -0.1% and less than 0. In addition, the Slow Average should be above the Median Average in the Didi Index.
# Needle
After the Needle Alert, we have the Needle Confirmation, which occurs when the Slow Average crosses the Median Average after the alert. This signal is used to enter the operation. Let's divide this signal into two parts:
1. Needle: We use a filter of "3" (adjustable). This means that, to be considered a "Needle", the candle distance between the Alert (crossing of the Fast Average with the Median Average) and the Confirmation (crossing of the Slow Average with the Median Average) must be equal to or less than 3 candles. Also, there needs to be a trend on the ADX and the Bollinger Bands should be open.
2. Queijo Minas Needle (QM): Essentially, it's a Needle that occurs outside of the filter, with a candle distance between the Alert and the Confirmation above "3" candles. A trend on the ADX and open Bollinger Bands are also necessary.
To anticipate the Needle Confirmation, we use the "Needle Projection" signal. This signal has two filters: the "Needle Projection with Alert", set as "0.1%", and the "Needle Projection after the Alert", set as "0.3%".
1. The "Needle Projection with Alert" generates the signal when the "Needle Alert" occurs (crossing of the Fast Average with the Median Average), as long as the difference between the Slow Average and the Median Average is less than 0.1%.
2. The "Needle Projection after the Alert" generates the signal when the Fast Average has already crossed the Median Average, and the difference between the Slow Average and the Median Average should be less than 0.3%.
# BJMA (Spider Woman's Kiss)
There is another variation of the needle called BJMA. Essentially, it occurs when the Fast Average and the Slow Average approach the Median Average (each on one pole), but do not cross the Median and return to where they came from. In this signal, we have two filters: "Delta BJMA previous candle" and "Delta BJMA current candle". Let's see an example:
• Buy BJMA: First, we observe the previous candle, where the Fast Average must be above 0 (above the Median Average) and the percentage difference should be less than 0.02. In relation to the Slow Average, the configuration is the same, but in the negative sense, that is, it should be below 0 and above -0.02. Now, in the current candle, the Fast Average should be above 0 and below 0.05, while the Slow Average should be below 0 and above -0.05.
• Sell BJMA: First, we observe the previous candle, where the Fast Average must be below 0 (below the Median Average) and the percentage difference should be greater than -0.02. In relation to the Slow Average, the configuration is the same, but in the positive sense, that is, it should be above 0 and below 0.02. Now, in the current candle, the Fast Average should be below 0 and above -0.05, while the Slow Average should be above 0 and below 0.05.
Now, let's look at two signals that are commonly used to stay in a position.
# Fake Point
The Fake Point is primarily used to identify retracements before a continuation of the prevailing trend. Typically, it is preceded by a Needle Confirmation or BJMA signal. Here are some examples:
• Fake Sell (Signal to Maintain a Buy Position): The Fast Average crosses the Median from top to bottom (entering the negative pole of the Didi Index), while the Slow Average, which is already below the Median (below 0), continues to decline further, increasing the percentage difference between the Fast and Slow Averages in the negative pole.
• Fake Buy (Signal to Maintain a Sell Position): It is the same as the fake sell scenario but in the positive pole. The Fast Average crosses the Median, entering the positive pole of the Didi Index, while the Slow Average, which was already above the Median, continues to increase the percentage difference with the Median. For example, if the Slow Average was at +1 on the Didi Index, it would now be at +1.3.
There is also another variation of the Fake Breakout that takes into consideration the ADX (Average Directional Index) to confirm the trend direction. In other words, if we have a fake sell signal that suggests a buy position, we want the ADX to indicate a buying trend, and vice versa.
# Bought and Sold
This signal basically checks whether the indicators continue to confirm the previous signals. There are two variations: "Bought/Sold" and "Bought/Sold without Bollinger Bands". Let's see an example:
• Bought: The Didi Index is in the buying position, which means the Fast Average is above the Median Average (above 0), and the Slow Average is below the Median Average. Additionally, the ADX is indicating a buying trend and the Bollinger Bands are open.
• Sold: The Didi Index is in the selling position, which means the Fast Average is below 0 and the Slow Average is above 0. Moreover, the ADX is indicating a selling trend and the Bollinger Bands are open.
• Bought/Sold without Bollinger Bands: It's the same signal, but without considering whether the Bollinger Bands are open or not.
We can also consider the "Bought/Sold" signal based on the Trix and Stochastic, which would be additional confirmations of the movement.
Personally, I do not activate the Bought/Sold signal.
Now we come to signals to exit the position or take partial profits.
# Close
This exit signal is based on the following indicators: ADX, Bollinger Bands, Trix, and Stochastic. We wait for the ADX Kick or the falling ADX, along with the Bollinger Bands closing, and the Trix and Stochastic changing to the opposite side. Let's see some examples:
• Close a Buy: The ADX was in a buying trend (ADX rising and DI+ above DI-), but then the ADX Kick occurs or the ADX starts to fall. In addition, the Bollinger Bands close, and the Trix and Stochastic should switch to the sell signal.
• Close a Sell: The ADX was in a selling trend (ADX rising and DI- above DI+), but then the ADX Kick occurs or the ADX starts to fall. Also, the Bollinger Bands close, and the Trix and Stochastic should switch to the buy signal.
All indicators must provide signals together, but it is not necessary for all to occur in the exact same candle. For example:
1. The ADX Kick may occur, and the Trix and Stochastic switch to the buy signal, but the Bollinger Bands still remain open. In this case, we still do not have the exit signal.
2. In the next candle, the ADX continues to fall (after the Kick), the Trix and Stochastic continue to indicate buying, but this time the Bollinger Bands close. In this case, we have the "Close a Sell" signal.
It is important that all indicators are in accordance with the necessary signals, even if they occur in different candles, in order for the exit signal to be triggered.
# Close with Alert
This signal occurs when the Didi Index switches to the opposite side from where it was, along with a trend on the ADX, provided it's not a fake point. Let's see some examples:
• Close Buy - Sell Alert: Suppose we were in a buy position on the previous candle. In the current candle, the Fast Average crosses the Median Average from top to bottom, and the ADX indicates a sell trend. In this case, we completely close our buy position or make a partial realization.
• Close Sell - Buy Alert: Suppose we were in a sell position on the previous candle. In the current candle, the Fast Average crosses the Median Average from bottom to top, and the ADX indicates a buy trend. In this case, we completely close our sell position or make a partial realization.
------------------------------------------------------------------------------------------------------------------------------------------------------------------------------------------------------------------
Indicador baseado no Color Candles - Didi's Needles setup , mas agora focado exclusivamente na geração de alertas.
Com esse indicador, você pode configurar alertas e notificações no TradingView para até 15 ativos com base no setup de Didi Aguiar. Além disso, é possível definir se o alerta deve ser acionado no fechamento do candle ou X minutos antes do fechamento.
Também foi adicionado um filtro de sessão que permite configurar os alertas para serem acionados apenas durante uma sessão específica.
Descrição dos sinais monitorados:
O setup consiste no cruzamento de 3 médias móveis, juntamente com a análise da tendência no ADX e das bandas de Bollinger abertas.
As médias móveis serão nomeadas "Didi Index". Teremos a média de 3 períodos como "Média Rápida", a média de 8 períodos como "Média Mediana" e a média de 20 períodos como "Média Lenta". Quando a Média Rápida cruzar a Média Mediana, teremos um alerta e, quando a Média Lenta cruzar a Média Mediana, teremos uma confirmação. Para ajustar o Didi Index nos sinais, a Média Mediana foi normalizada, isto é, ela sempre será igual a 0. Para a Média Lenta e a Média Rápida, levaremos em consideração apenas a diferença percentual em relação à Média Mediana.
Além das médias móveis, analisamos se o ADX está em ascensão, com o DI+ acima do DI- para indicar uma tendência de alta, ou se o ADX está subindo, com o DI- acima do DI+ para indicar uma tendência de baixa. Também verificamos se as bandas de Bollinger estão abertas. Com essas condições, teremos uma Agulhada.
Agora vou detalhar como estabeleci isso no indicador e alguns filtros que inseri para o meu uso pessoal, além de alguns sinais adicionais do setup.
# Alerta de Agulhada
Primeiramente, temos o sinal de "Alerta de Agulhada". Este sinal acontece quando a Média Rápida cruza a Média Mediana, junto com a confirmação da tendência no ADX e a abertura das Bandas de Bollinger. O filtro está ajustado em "1", o que significa que só levaremos em consideração o alerta de agulhada quando a diferença percentual entre a Média Lenta e a Média Mediana estiver abaixo de 1%. Esse sinal pode ser utilizado como um ponto de entrada ou para monitorar o ativo. Vamos aos exemplos:
• Para um "Alerta de Compra", a Média Rápida deve cruzar a Média Mediana de baixo para cima, e a diferença percentual entre a Média Lenta e a Média Mediana deve ser menor que +1% e maior que 0, conforme indicado pelo Didi Index.
• Para um "Alerta de Venda", a Média Rápida deve cruzar a Média Mediana de cima para baixo, e a diferença percentual entre a Média Lenta e a Média Mediana deve ser maior que -1% e menor que 0, conforme indicado pelo Didi Index.
Também temos a projeção do alerta, que serve como um sinal para chamar atenção e monitorar o ativo. Eu uso um filtro de "0.1", o que significa que a diferença percentual entre a Média Rápida e a Média Mediana deve ser igual ou menor que 0.1%. Vamos ver o exemplo:
• Para uma "Projeção de Alerta de Compra", a Média Rápida deve estar abaixo da Média Mediana, e a diferença percentual entre a Média Rápida e a Média Mediana deve ser maior que -0.1% e menor que 0. Além disso, a Média Lenta deve estar acima da Média Mediana no Didi Index.
• Para uma "Projeção de Alerta de Compra", a Média Rápida deve estar abaixo da Média Mediana, e a diferença percentual entre a Média Rápida e a Média Mediana deve ser maior que -0.1% e menor que 0. Além disso, a Média Lenta deve estar acima da Média Mediana no Didi Index.
# Agulhada
Após o Alerta de Agulhada, temos a confirmação da Agulhada, que ocorre quando a Média Lenta cruza a Média Mediana após o alerta. Esse sinal é utilizado para entrar na operação. Vamos dividir esse sinal em duas partes:
1. Agulhada: Utilizamos um filtro de "3" (ajustável). Isso significa que, para ser considerada uma "Agulhada", a distância em velas entre o Alerta (cruzamento da Média Rápida com a Média Mediana) e a Confirmação (cruzamento da Média Lenta com a Média Mediana) deve ser igual ou menor que 3 velas. Além disso, é necessário ter uma tendência no ADX e as Bandas de Bollinger devem estar abertas.
2. Agulhada Queijo Minas (QM): Basicamente, é uma agulhada que ocorre fora do filtro, com uma distância em velas entre o Alerta e a Confirmação acima de "3" velas. Também é necessário ter uma tendência no ADX e as Bandas de Bollinger devem estar abertas.
Para antecipar a confirmação da Agulhada, utilizamos o sinal de "Projeção de Agulhada". Esse sinal possui dois filtros: o "Projeção de Agulhada com Alerta", configurado como "0.1%", e o "Projeção de Agulhada após o Alerta", configurado como "0.3%".
1. "Projeção de Agulhada com Alerta" gera o sinal quando ocorre o "Alerta de Agulhada" (cruzamento da Média Rápida com a Média Mediana), desde que a diferença entre a Média Lenta e a Média Mediana seja menor que 0.1%.
2. "Projeção de Agulhada após o Alerta" gera o sinal quando a Média Rápida já cruzou a Média Mediana, e a diferença entre a Média Lenta e a Média Mediana deve ser menor que 0.3%.
# BJMA (Beijo da Mulher Aranha)
Existe uma outra variação da agulhada chamada BJMA. Essencialmente, ocorre quando a Média Rápida e a Média Lenta se aproximam da Média Mediana (cada uma em um polo), mas não cruzam a Mediana e voltam para o lado de onde vieram. Nesse sinal, temos dois filtros: "Delta BJMA vela anterior" e "Delta BJMA vela atual". Vejamos um exemplo:
• BJMA de Compra: Primeiramente, observamos a vela anterior, onde a Média Rápida deve estar acima de 0 (acima da Média Mediana) e a diferença percentual deve ser menor que 0.02. Em relação à Média Lenta, a configuração é a mesma, porém no sentido negativo, ou seja, ela deve estar abaixo de 0 e acima de -0.02. Agora, na vela atual, a Média Rápida deve estar acima de 0 e abaixo de 0.05, enquanto a Média Lenta deve estar abaixo de 0 e acima de -0.05.
• BJMA de Venda: Primeiramente, observamos a vela anterior, onde a Média Rápida deve estar abaixo de 0 (abaixo da Média Mediana) e a diferença percentual deve ser maior que -0.02. Em relação à Média Lenta, a configuração é a mesma, porém no sentido positivo, ou seja, ela deve estar acima de 0 e abaixo de 0.02. Agora, na vela atual, a Média Rápida deve estar abaixo de 0 e acima de -0.05, enquanto a Média Lenta deve estar acima de 0 e abaixo de 0.05.
Agora vamos abordar dois sinais que são normalmente utilizados para manter uma posição.
# Ponto Falso (Fake Point)
O Ponto Falso é usado para identificar uma retração antes de retomar o movimento. Geralmente, ele ocorre após um sinal de Agulhada ou BJMA. Vejamos exemplos:
• Venda Falsa (sinal para manter uma posição de compra): A Média Rápida cruza a Média Mediana de cima para baixo (entrando no polo negativo do Didi Index), enquanto a Média Lenta, que já está abaixo da Média Mediana (abaixo de 0), continua caindo, aumentando assim a diferença percentual entre a Média Lenta e a Média Mediana no polo negativo.
• Compra Falsa (sinal para manter uma posição de venda): O cenário é semelhante, mas no polo positivo. A Média Rápida cruza a Média Mediana, passando para o lado positivo do Didi Index, enquanto a Média Lenta, que já estava acima da Média Mediana, continua aumentando a diferença percentual em relação à Média Mediana. Por exemplo, se a Média Lenta estava em +1 no Didi Index, agora ela está em +1.3.
Também existe uma variação do Ponto Falso em que verificamos se a tendência no ADX está se mantendo na mesma direção. Ou seja, se tivermos uma Venda Falsa (que seria um sinal para permanecermos em uma posição de compra), é importante que o ADX esteja indicando uma tendência de compra, e vice-versa. Dessa forma, consideramos não apenas o cruzamento das médias, mas também a confirmação da tendência no ADX. Essa variação é chamada de Ponto Falso com Tendência (Fake Point with Trend).
# Comprado e Vendido
Esse sinal, essencialmente, verifica se os indicadores estão mantendo a confirmação dos sinais anteriores. Existem duas variações: "Comprado/Vendido" e "Comprado/Vendido sem Bandas de Bollinger". Vejamos um exemplo:
• Comprado: O Didi Index está em compra, o que significa que a Média Rápida está acima da Média Mediana (acima de 0) e a Média Lenta está abaixo da Média Mediana. Além disso, o ADX está indicando uma tendência de compra e as Bandas de Bollinger estão abertas.
• Vendido: O Didi Index está em venda, o que significa que a Média Rápida está abaixo de 0 e a Média Lenta está acima de 0. Além disso, o ADX está indicando uma tendência de venda e as Bandas de Bollinger estão abertas.
• Comprado/Vendido sem Bollinger: É o mesmo sinal, porém sem considerar se as Bandas de Bollinger estão abertas ou não.
Podemos também considerar o "Comprado/Vendido" com base no Trix e no Estocástico, que seriam confirmações adicionais do movimento.
Eu, pessoalmente, não deixo ativado o sinal de Comprado/Vendido.
Agora chegamos aos sinais de saída da posição ou de realização parcial.
# Fechar (Close)
Este sinal de saída baseia-se nos seguintes indicadores: ADX, Bandas de Bollinger, Trix e Estocástico. Aguardamos o Kick do ADX ou o ADX em queda, juntamente com as Bandas de Bollinger se fechando, e o Trix e o Estocástico mudando para o lado oposto. Vamos ver alguns exemplos:
• Fechar uma Compra (Close Buy): O ADX estava em uma tendência de compra (ADX subindo e DI+ acima do DI-), mas em seguida ocorre o Kick do ADX ou o ADX começa a cair. Além disso, as Bandas de Bollinger se fecham e o Trix e o Estocástico devem mudar para o sinal de venda.
• Fechar uma Venda (Close Sell): O ADX estava em uma tendência de venda (ADX subindo e DI- acima do DI+), mas em seguida ocorre o Kick do ADX ou o ADX começa a cair. Além disso, as Bandas de Bollinger se fecham e o Trix e o Estocástico devem mudar para o sinal de compra.
Todos os indicadores devem fornecer os sinais em conjunto, mas não é necessário que todos ocorram exatamente na mesma vela. Por exemplo:
1. Pode ocorrer o Kick do ADX e o Trix e o Estocástico mudarem para o sinal de compra, mas as Bandas de Bollinger ainda permanecerem abertas. Nesse caso, ainda não teremos o sinal de saída.
2. No candle seguinte, o ADX continua caindo (após o Kick), o Trix e o Estocástico continuam indicando compra, mas desta vez as Bandas de Bollinger se fecham. Nesse caso, teremos o sinal de "Fechamento de uma Venda".
É importante que todos os indicadores estejam em conformidade com os sinais necessários, mesmo que ocorram em velas diferentes, para que seja acionado o sinal de saída.
# Fechar com Alerta (Close with Alert)
Esse sinal ocorre quando o Didi Index muda para o lado oposto do que estava, juntamente com uma tendência no ADX, desde que não seja um ponto falso. Vejamos exemplos:
• Fechar Compra - Alerta de Venda: Suponha que estávamos em uma posição de compra no candle anterior. No candle atual, a Média Rápida cruza a Média Mediana de cima para baixo, e o ADX indica uma tendência de venda. Nesse caso, encerramos completamente nossa posição de compra ou realizamos uma realização parcial.
• Fechar Venda – Alerta de Compra: Suponha que estávamos em uma posição de venda no candle anterior. No candle atual, a Média Rápida cruza a Média Mediana de baixo para cima, e o ADX indica uma tendência de compra. Nesse caso, encerramos completamente nossa posição de venda ou realizamos uma realização parcial.

Color Candles - Didi's Needles setup [HeegerBot]Coloration Indicator based on Didi Aguiar's needle setup.
Indicador de Coloração baseado no setup de agulhadas do Didi Aguiar.
The setup consists of the crossover of three moving averages, along with the analysis of an ascending trend in the ADX and the opening of Bollinger Bands.
The setup involves the crossing of three moving averages, along with the trend analysis in the ADX and the open Bollinger Bands.
The moving averages will be named "Didi Index". We will have the 3-period average as "Fast Average", the 8-period average as "Median Average", and the 20-period average as "Slow Average". When the Fast Average crosses the Median Average, we will have an alert, and when the Slow Average crosses the Median Average, we will have a confirmation. To adjust the Didi Index in the signals, the Median Average was normalized, that is, it will always be equal to 0. For the Slow and Fast Average, we will only consider the percentage difference in relation to the Median Average.
In addition to the moving averages, we analyze whether the ADX is rising, with DI+ above DI- to indicate an uptrend, or if the ADX is rising, with DI- above DI+ to indicate a downtrend. We also check if the Bollinger Bands are open. With these conditions, we will have a Needle.
Now I'm going to detail how I set this up on the indicator and some filters that I inserted for my personal use, along with some additional signals from the setup.
# Needle Alert
Firstly, we have the "Needle Alert" signal. This signal occurs when the Fast Average crosses the Median Average, along with the trend confirmation in the ADX and the opening of the Bollinger Bands. The filter is set at "1", which means we will only consider the needle alert when the percentage difference between the Slow Average and the Median Average is below 1%. This signal can be used as an entry point or to monitor the asset. Let's go through the examples:
• For a "Buy Alert", the Fast Average must cross the Median Average from bottom to top, and the percentage difference between the Slow Average and the Median Average should be less than +1% and greater than 0, as indicated by the Didi Index.
• For a "Sell Alert", the Fast Average must cross the Median Average from top to bottom, and the percentage difference between the Slow Average and the Median Average should be greater than -1% and less than 0, as indicated by the Didi Index.
We also have the alert projection, which serves as a signal to attract attention and monitor the asset. I use a "0.1" filter, which means that the percentage difference between the Fast Average and the Median Average must be equal to or less than 0.1%. Let's look at the example:
• For a "Buy Alert Projection", the Fast Average should be below the Median Average, and the percentage difference between the Fast Average and the Median Average should be greater than -0.1% and less than 0. In addition, the Slow Average should be above the Median Average in the Didi Index.
• For a "Buy Alert Projection", the Fast Average should be below the Median Average, and the percentage difference between the Fast Average and the Median Average should be greater than -0.1% and less than 0. In addition, the Slow Average should be above the Median Average in the Didi Index.
# Needle
After the Needle Alert, we have the Needle Confirmation, which occurs when the Slow Average crosses the Median Average after the alert. This signal is used to enter the operation. Let's divide this signal into two parts:
1. Needle: We use a filter of "3" (adjustable). This means that, to be considered a "Needle", the candle distance between the Alert (crossing of the Fast Average with the Median Average) and the Confirmation (crossing of the Slow Average with the Median Average) must be equal to or less than 3 candles. Also, there needs to be a trend on the ADX and the Bollinger Bands should be open.
2. Queijo Minas Needle (QM): Essentially, it's a Needle that occurs outside of the filter, with a candle distance between the Alert and the Confirmation above "3" candles. A trend on the ADX and open Bollinger Bands are also necessary.
To anticipate the Needle Confirmation, we use the "Needle Projection" signal. This signal has two filters: the "Needle Projection with Alert", set as "0.1%", and the "Needle Projection after the Alert", set as "0.3%".
1. The "Needle Projection with Alert" generates the signal when the "Needle Alert" occurs (crossing of the Fast Average with the Median Average), as long as the difference between the Slow Average and the Median Average is less than 0.1%.
2. The "Needle Projection after the Alert" generates the signal when the Fast Average has already crossed the Median Average, and the difference between the Slow Average and the Median Average should be less than 0.3%.
# BJMA (Spider Woman's Kiss)
There is another variation of the needle called BJMA. Essentially, it occurs when the Fast Average and the Slow Average approach the Median Average (each on one pole), but do not cross the Median and return to where they came from. In this signal, we have two filters: "Delta BJMA previous candle" and "Delta BJMA current candle". Let's see an example:
• Buy BJMA: First, we observe the previous candle, where the Fast Average must be above 0 (above the Median Average) and the percentage difference should be less than 0.02. In relation to the Slow Average, the configuration is the same, but in the negative sense, that is, it should be below 0 and above -0.02. Now, in the current candle, the Fast Average should be above 0 and below 0.05, while the Slow Average should be below 0 and above -0.05.
• Sell BJMA: First, we observe the previous candle, where the Fast Average must be below 0 (below the Median Average) and the percentage difference should be greater than -0.02. In relation to the Slow Average, the configuration is the same, but in the positive sense, that is, it should be above 0 and below 0.02. Now, in the current candle, the Fast Average should be below 0 and above -0.05, while the Slow Average should be above 0 and below 0.05.
Now, let's look at two signals that are commonly used to stay in a position.
# Fake Point
The Fake Point is primarily used to identify retracements before a continuation of the prevailing trend. Typically, it is preceded by a Needle Confirmation or BJMA signal. Here are some examples:
• Fake Sell (Signal to Maintain a Buy Position): The Fast Average crosses the Median from top to bottom (entering the negative pole of the Didi Index), while the Slow Average, which is already below the Median (below 0), continues to decline further, increasing the percentage difference between the Fast and Slow Averages in the negative pole.
• Fake Buy (Signal to Maintain a Sell Position): It is the same as the fake sell scenario but in the positive pole. The Fast Average crosses the Median, entering the positive pole of the Didi Index, while the Slow Average, which was already above the Median, continues to increase the percentage difference with the Median. For example, if the Slow Average was at +1 on the Didi Index, it would now be at +1.3.
There is also another variation of the Fake Breakout that takes into consideration the ADX (Average Directional Index) to confirm the trend direction. In other words, if we have a fake sell signal that suggests a buy position, we want the ADX to indicate a buying trend, and vice versa.
# Bought and Sold
This signal basically checks whether the indicators continue to confirm the previous signals. There are two variations: "Bought/Sold" and "Bought/Sold without Bollinger Bands". Let's see an example:
• Bought: The Didi Index is in the buying position, which means the Fast Average is above the Median Average (above 0), and the Slow Average is below the Median Average. Additionally, the ADX is indicating a buying trend and the Bollinger Bands are open.
• Sold: The Didi Index is in the selling position, which means the Fast Average is below 0 and the Slow Average is above 0. Moreover, the ADX is indicating a selling trend and the Bollinger Bands are open.
• Bought/Sold without Bollinger Bands: It's the same signal, but without considering whether the Bollinger Bands are open or not.
We can also consider the "Bought/Sold" signal based on the Trix and Stochastic, which would be additional confirmations of the movement.
Personally, I do not activate the Bought/Sold signal.
Now we come to signals to exit the position or take partial profits.
# Close
This exit signal is based on the following indicators: ADX, Bollinger Bands, Trix, and Stochastic. We wait for the ADX Kick or the falling ADX, along with the Bollinger Bands closing, and the Trix and Stochastic changing to the opposite side. Let's see some examples:
• Close a Buy: The ADX was in a buying trend (ADX rising and DI+ above DI-), but then the ADX Kick occurs or the ADX starts to fall. In addition, the Bollinger Bands close, and the Trix and Stochastic should switch to the sell signal.
• Close a Sell: The ADX was in a selling trend (ADX rising and DI- above DI+), but then the ADX Kick occurs or the ADX starts to fall. Also, the Bollinger Bands close, and the Trix and Stochastic should switch to the buy signal.
All indicators must provide signals together, but it is not necessary for all to occur in the exact same candle. For example:
1. The ADX Kick may occur, and the Trix and Stochastic switch to the buy signal, but the Bollinger Bands still remain open. In this case, we still do not have the exit signal.
2. In the next candle, the ADX continues to fall (after the Kick), the Trix and Stochastic continue to indicate buying, but this time the Bollinger Bands close. In this case, we have the "Close a Sell" signal.
It is important that all indicators are in accordance with the necessary signals, even if they occur in different candles, in order for the exit signal to be triggered.
# Close with Alert
This signal occurs when the Didi Index switches to the opposite side from where it was, along with a trend on the ADX, provided it's not a fake point. Let's see some examples:
• Close Buy - Sell Alert: Suppose we were in a buy position on the previous candle. In the current candle, the Fast Average crosses the Median Average from top to bottom, and the ADX indicates a sell trend. In this case, we completely close our buy position or make a partial realization.
• Close Sell - Buy Alert: Suppose we were in a sell position on the previous candle. In the current candle, the Fast Average crosses the Median Average from bottom to top, and the ADX indicates a buy trend. In this case, we completely close our sell position or make a partial realization.
# Divergence in Didi Index and Stochastic.
The signal of divergence in the Didi Index and the Stochastic is used to identify situations where there is a divergence in one of these indicators. When identified, a box will be drawn in the region where the divergence occurred. This region is considered an area of conflict or strength.
Depending on the context of the chart, these regions can be used as points for total or partial exit of positions. This happens because there may be a correction of the movement after these divergences occur. In some cases, if there is an ignition candle that breaks through this region, it can be used as a possible entry point into the position, taking advantage of a possible pullback.
It is recommended to wait for the candle to close before considering the signals, as this allows for a more solid confirmation.
---------------------------------------------------------------------------------------------------------------------
Indicador de Coloração baseado no setup de agulhadas do Didi Aguiar.
O setup consiste no cruzamento de 3 médias móveis, juntamente com a análise da tendência no ADX e das bandas de Bollinger abertas.
As médias móveis serão nomeadas "Didi Index". Teremos a média de 3 períodos como "Média Rápida", a média de 8 períodos como "Média Mediana" e a média de 20 períodos como "Média Lenta". Quando a Média Rápida cruzar a Média Mediana, teremos um alerta e, quando a Média Lenta cruzar a Média Mediana, teremos uma confirmação. Para ajustar o Didi Index nos sinais, a Média Mediana foi normalizada, isto é, ela sempre será igual a 0. Para a Média Lenta e a Média Rápida, levaremos em consideração apenas a diferença percentual em relação à Média Mediana.
Além das médias móveis, analisamos se o ADX está em ascensão, com o DI+ acima do DI- para indicar uma tendência de alta, ou se o ADX está subindo, com o DI- acima do DI+ para indicar uma tendência de baixa. Também verificamos se as bandas de Bollinger estão abertas. Com essas condições, teremos uma Agulhada.
Agora vou detalhar como estabeleci isso no indicador e alguns filtros que inseri para o meu uso pessoal, além de alguns sinais adicionais do setup.
# Alerta de Agulhada
Primeiramente, temos o sinal de "Alerta de Agulhada". Este sinal acontece quando a Média Rápida cruza a Média Mediana, junto com a confirmação da tendência no ADX e a abertura das Bandas de Bollinger. O filtro está ajustado em "1", o que significa que só levaremos em consideração o alerta de agulhada quando a diferença percentual entre a Média Lenta e a Média Mediana estiver abaixo de 1%. Esse sinal pode ser utilizado como um ponto de entrada ou para monitorar o ativo. Vamos aos exemplos:
• Para um "Alerta de Compra", a Média Rápida deve cruzar a Média Mediana de baixo para cima, e a diferença percentual entre a Média Lenta e a Média Mediana deve ser menor que +1% e maior que 0, conforme indicado pelo Didi Index.
• Para um "Alerta de Venda", a Média Rápida deve cruzar a Média Mediana de cima para baixo, e a diferença percentual entre a Média Lenta e a Média Mediana deve ser maior que -1% e menor que 0, conforme indicado pelo Didi Index.
Também temos a projeção do alerta, que serve como um sinal para chamar atenção e monitorar o ativo. Eu uso um filtro de "0.1", o que significa que a diferença percentual entre a Média Rápida e a Média Mediana deve ser igual ou menor que 0.1%. Vamos ver o exemplo:
• Para uma "Projeção de Alerta de Compra", a Média Rápida deve estar abaixo da Média Mediana, e a diferença percentual entre a Média Rápida e a Média Mediana deve ser maior que -0.1% e menor que 0. Além disso, a Média Lenta deve estar acima da Média Mediana no Didi Index.
• Para uma "Projeção de Alerta de Compra", a Média Rápida deve estar abaixo da Média Mediana, e a diferença percentual entre a Média Rápida e a Média Mediana deve ser maior que -0.1% e menor que 0. Além disso, a Média Lenta deve estar acima da Média Mediana no Didi Index.
# Agulhada
Após o Alerta de Agulhada, temos a confirmação da Agulhada, que ocorre quando a Média Lenta cruza a Média Mediana após o alerta. Esse sinal é utilizado para entrar na operação. Vamos dividir esse sinal em duas partes:
1. Agulhada: Utilizamos um filtro de "3" (ajustável). Isso significa que, para ser considerada uma "Agulhada", a distância em velas entre o Alerta (cruzamento da Média Rápida com a Média Mediana) e a Confirmação (cruzamento da Média Lenta com a Média Mediana) deve ser igual ou menor que 3 velas. Além disso, é necessário ter uma tendência no ADX e as Bandas de Bollinger devem estar abertas.
2. Agulhada Queijo Minas (QM): Basicamente, é uma agulhada que ocorre fora do filtro, com uma distância em velas entre o Alerta e a Confirmação acima de "3" velas. Também é necessário ter uma tendência no ADX e as Bandas de Bollinger devem estar abertas.
Para antecipar a confirmação da Agulhada, utilizamos o sinal de "Projeção de Agulhada". Esse sinal possui dois filtros: o "Projeção de Agulhada com Alerta", configurado como "0.1%", e o "Projeção de Agulhada após o Alerta", configurado como "0.3%".
1. "Projeção de Agulhada com Alerta" gera o sinal quando ocorre o "Alerta de Agulhada" (cruzamento da Média Rápida com a Média Mediana), desde que a diferença entre a Média Lenta e a Média Mediana seja menor que 0.1%.
2. "Projeção de Agulhada após o Alerta" gera o sinal quando a Média Rápida já cruzou a Média Mediana, e a diferença entre a Média Lenta e a Média Mediana deve ser menor que 0.3%.
# BJMA (Beijo da Mulher Aranha)
Existe uma outra variação da agulhada chamada BJMA. Essencialmente, ocorre quando a Média Rápida e a Média Lenta se aproximam da Média Mediana (cada uma em um polo), mas não cruzam a Mediana e voltam para o lado de onde vieram. Nesse sinal, temos dois filtros: "Delta BJMA vela anterior" e "Delta BJMA vela atual". Vejamos um exemplo:
• BJMA de Compra: Primeiramente, observamos a vela anterior, onde a Média Rápida deve estar acima de 0 (acima da Média Mediana) e a diferença percentual deve ser menor que 0.02. Em relação à Média Lenta, a configuração é a mesma, porém no sentido negativo, ou seja, ela deve estar abaixo de 0 e acima de -0.02. Agora, na vela atual, a Média Rápida deve estar acima de 0 e abaixo de 0.05, enquanto a Média Lenta deve estar abaixo de 0 e acima de -0.05.
• BJMA de Venda: Primeiramente, observamos a vela anterior, onde a Média Rápida deve estar abaixo de 0 (abaixo da Média Mediana) e a diferença percentual deve ser maior que -0.02. Em relação à Média Lenta, a configuração é a mesma, porém no sentido positivo, ou seja, ela deve estar acima de 0 e abaixo de 0.02. Agora, na vela atual, a Média Rápida deve estar abaixo de 0 e acima de -0.05, enquanto a Média Lenta deve estar acima de 0 e abaixo de 0.05.
Agora vamos abordar dois sinais que são normalmente utilizados para manter uma posição.
# Ponto Falso (Fake Point)
O Ponto Falso é usado para identificar uma retração antes de retomar o movimento. Geralmente, ele ocorre após um sinal de Agulhada ou BJMA. Vejamos exemplos:
• Venda Falsa (sinal para manter uma posição de compra): A Média Rápida cruza a Média Mediana de cima para baixo (entrando no polo negativo do Didi Index), enquanto a Média Lenta, que já está abaixo da Média Mediana (abaixo de 0), continua caindo, aumentando assim a diferença percentual entre a Média Lenta e a Média Mediana no polo negativo.
• Compra Falsa (sinal para manter uma posição de venda): O cenário é semelhante, mas no polo positivo. A Média Rápida cruza a Média Mediana, passando para o lado positivo do Didi Index, enquanto a Média Lenta, que já estava acima da Média Mediana, continua aumentando a diferença percentual em relação à Média Mediana. Por exemplo, se a Média Lenta estava em +1 no Didi Index, agora ela está em +1.3.
Também existe uma variação do Ponto Falso em que verificamos se a tendência no ADX está se mantendo na mesma direção. Ou seja, se tivermos uma Venda Falsa (que seria um sinal para permanecermos em uma posição de compra), é importante que o ADX esteja indicando uma tendência de compra, e vice-versa. Dessa forma, consideramos não apenas o cruzamento das médias, mas também a confirmação da tendência no ADX. Essa variação é chamada de Ponto Falso com Tendência (Fake Point with Trend).
# Comprado e Vendido
Esse sinal, essencialmente, verifica se os indicadores estão mantendo a confirmação dos sinais anteriores. Existem duas variações: "Comprado/Vendido" e "Comprado/Vendido sem Bandas de Bollinger". Vejamos um exemplo:
• Comprado: O Didi Index está em compra, o que significa que a Média Rápida está acima da Média Mediana (acima de 0) e a Média Lenta está abaixo da Média Mediana. Além disso, o ADX está indicando uma tendência de compra e as Bandas de Bollinger estão abertas.
• Vendido: O Didi Index está em venda, o que significa que a Média Rápida está abaixo de 0 e a Média Lenta está acima de 0. Além disso, o ADX está indicando uma tendência de venda e as Bandas de Bollinger estão abertas.
• Comprado/Vendido sem Bollinger: É o mesmo sinal, porém sem considerar se as Bandas de Bollinger estão abertas ou não.
Podemos também considerar o "Comprado/Vendido" com base no Trix e no Estocástico, que seriam confirmações adicionais do movimento.
Eu, pessoalmente, não deixo ativado o sinal de Comprado/Vendido.
Agora chegamos aos sinais de saída da posição ou de realização parcial.
# Fechar (Close)
Este sinal de saída baseia-se nos seguintes indicadores: ADX, Bandas de Bollinger, Trix e Estocástico. Aguardamos o Kick do ADX ou o ADX em queda, juntamente com as Bandas de Bollinger se fechando, e o Trix e o Estocástico mudando para o lado oposto. Vamos ver alguns exemplos:
• Fechar uma Compra (Close Buy): O ADX estava em uma tendência de compra (ADX subindo e DI+ acima do DI-), mas em seguida ocorre o Kick do ADX ou o ADX começa a cair. Além disso, as Bandas de Bollinger se fecham e o Trix e o Estocástico devem mudar para o sinal de venda.
• Fechar uma Venda (Close Sell): O ADX estava em uma tendência de venda (ADX subindo e DI- acima do DI+), mas em seguida ocorre o Kick do ADX ou o ADX começa a cair. Além disso, as Bandas de Bollinger se fecham e o Trix e o Estocástico devem mudar para o sinal de compra.
Todos os indicadores devem fornecer os sinais em conjunto, mas não é necessário que todos ocorram exatamente na mesma vela. Por exemplo:
1. Pode ocorrer o Kick do ADX e o Trix e o Estocástico mudarem para o sinal de compra, mas as Bandas de Bollinger ainda permanecerem abertas. Nesse caso, ainda não teremos o sinal de saída.
2. No candle seguinte, o ADX continua caindo (após o Kick), o Trix e o Estocástico continuam indicando compra, mas desta vez as Bandas de Bollinger se fecham. Nesse caso, teremos o sinal de "Fechamento de uma Venda".
É importante que todos os indicadores estejam em conformidade com os sinais necessários, mesmo que ocorram em velas diferentes, para que seja acionado o sinal de saída.
# Fechar com Alerta (Close with Alert)
Esse sinal ocorre quando o Didi Index muda para o lado oposto do que estava, juntamente com uma tendência no ADX, desde que não seja um ponto falso. Vejamos exemplos:
• Fechar Compra - Alerta de Venda: Suponha que estávamos em uma posição de compra no candle anterior. No candle atual, a Média Rápida cruza a Média Mediana de cima para baixo, e o ADX indica uma tendência de venda. Nesse caso, encerramos completamente nossa posição de compra ou realizamos uma realização parcial.
• Fechar Venda – Alerta de Compra: Suponha que estávamos em uma posição de venda no candle anterior. No candle atual, a Média Rápida cruza a Média Mediana de baixo para cima, e o ADX indica uma tendência de compra. Nesse caso, encerramos completamente nossa posição de venda ou realizamos uma realização parcial.
# Divergência no Didi Index e no Estocástico.
O sinal de divergência no Didi Index e no Estocástico é usado para identificar situações onde há uma divergência em um desses indicadores. Quando identificada, uma caixa será desenhada na área onde a divergência ocorreu. Essa área é considerada uma zona de briga ou força.
Dependendo do contexto do gráfico, essas zonas podem ser usadas como pontos de saída total ou parcial das posições. Isso acontece porque pode haver uma correção do movimento após a ocorrência dessas divergências. Em alguns casos, se houver uma vela de ignição que quebre essa zona, ela pode ser usada como um possível ponto de entrada na posição, aproveitando um possível pullback.
É recomendado aguardar o fechamento do candle para levar os sinais em consideração, pois isso permite obter uma confirmação mais sólida.

FalconRed 5 EMA Indicator (Powerofstocks)Improved version:
This indicator is based on Subhashish Pani's "Power of Stocks" 5 EMA Strategy, which aims to identify potential buying and selling opportunities in the market. The indicator plots the 5 EMA (Exponential Moving Average) and generates Buy/Sell signals with corresponding Target and Stoploss levels.
Subhashish Pani's 5 EMA Strategy is a straightforward approach. For intraday trading, a 5-minute timeframe is recommended for selling. In this strategy, you can choose to sell futures, sell calls, or buy puts as part of your selling strategy. The goal is to capture market tops by selling at the peak, anticipating a reversal for profitable trades. Although this strategy may result in frequent stop losses, they are typically small, while the minimum target should be at least three times the risk taken. By staying aligned with the trend, significant profits can be achieved. Subhashish Pani claims that this strategy has a 60% success rate.
Strategy for Selling (Short Future/Call/Stock or Buy Put):
1. When a candle completely closes above the 5 EMA (with no part of the candle touching the 5 EMA), it is considered an Alert Candle.
2. If the next candle is also entirely above the 5 EMA and does not break the low of the previous Alert Candle, ignore the previous Alert Candle and consider the new candle as the new Alert Candle.
3. Continue shifting the Alert Candle in this manner. However, when the next candle breaks the low of the Alert Candle, take a short trade (e.g., short futures, calls, stocks, or buy puts).
4. Set the stop loss above the high of the Alert Candle, and the minimum target should be 1:3 (at least three times the stop loss).
Strategy for Buying (Buy Future/Call/Stock or Sell Put):
1. When a candle completely closes below the 5 EMA (with no part of the candle touching the 5 EMA), it is considered an Alert Candle.
2. If the next candle is also entirely below the 5 EMA and does not break the high of the previous Alert Candle, ignore the previous Alert Candle and consider the new candle as the new Alert Candle.
3. Continue shifting the Alert Candle in this manner. However, when the next candle breaks the high of the Alert Candle, take a long trade (e.g., buy futures, calls, stocks, or sell puts).
4. Set the stop loss below the low of the Alert Candle, and the minimum target should be 1:3 (at least three times the stop loss).
Buy/Sell with Additional Conditions:
An additional condition is added to the buying/selling strategy:
1. Check if the closing price of the current candle is lower than the closing price of the Alert Candle for selling, or higher than the closing price of the Alert Candle for buying.
- This condition aims to filter out false moves, potentially preventing entering trades based on temporary fluctuations. However, it may cause you to miss out on significant moves, as you will enter trades after the candle closes, rather than at the breakout point.
Note: According to Subhashish Pani, the recommended timeframe for intraday buying is 15 minutes. However, this strategy can also be applied to positional/swing trading. If used on a monthly timeframe, it can be beneficial for long-term investing as well. The rules remain the same for all types of trades and timeframes.
If you need a deeper understanding of this strategy, you can search for "Subhashish Pani's (Power of Stocks) 5 EMA Strategy" on YouTube for further explanations.
Note: This strategy is not limited to intraday trading and can be applied to positional/swing
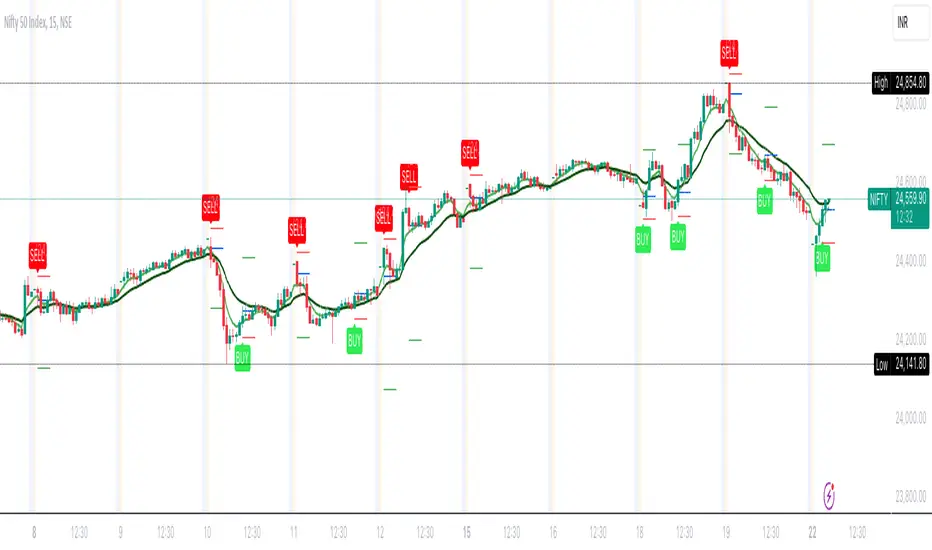
Pressure - Buying and SellingThis is the Pressure Indicator.
The Pressure Indicator analyzes a number of price ratios to measure the pressure of Buyers and Sellers.
I’ve also added to the indicator:
1) Moving Averages (MA) – You can choose 3 types of MA:
- Simple Moving Average (SMA)
- Exponential Moving Average (EMA) - default
- Volume Weighted Moving Average (VWMA)
- Arnaud Legoux Moving Average (ALMA)
By default the MA are not displayed. You can turn them on or off.
2) Standard Deviation Bands and MA Bands – Bands only for the MA type 1 selection. Usually, the Pressureis inside the Bands. If it is beyond the Bands that could mean the current trend is ending. The MA Bands are turned off by default but you can turn them on the Styles Tab Menu.
3) Levels for Overbought and Oversold Zones:
- Gray Overbought 60
- Gray Oversold 40
4) Levels for Buying and Selling Pressure (3 types of pressure + 1 more). If the Pressure is crossing various intermediate levels that means there is Buying or Selling Pressure at those levels.
5) Signals for Crossing Overbought and Oversold Levels:
- Top Red fills for Crossing Down Overbought Level
- Bottom Lime fills for Crossing Up Oversold Level
6) Signals for Buying and Selling Pressure:
- Buy Pressure 1 and 2 are the smaller lime dots.
- Buy Pressure 1 and 2 together are the bigger lime dots.
- Buy Pressure 3 (Crossing Deviation Bands Up) are the blue dots.
- Sell Pressure 1 and 2 are the smaller red dots.
- Sell Pressure 1 and 2 together are the bigger red dots.
- Sell Pressure 3 (Crossing Deviation Bands Down) are the orange dots.
If there are more than one dot appearing at the same moment they will appear displaced in a vertical way at the same time.
If there is something wrong with the code or its calculations, please let me know.
If you want to modify or improve the code, feel free to do that, but please let me know the changes you made.
This Indicator is very accurate when using the Weekly Timeframe . I hope you enjoy it!
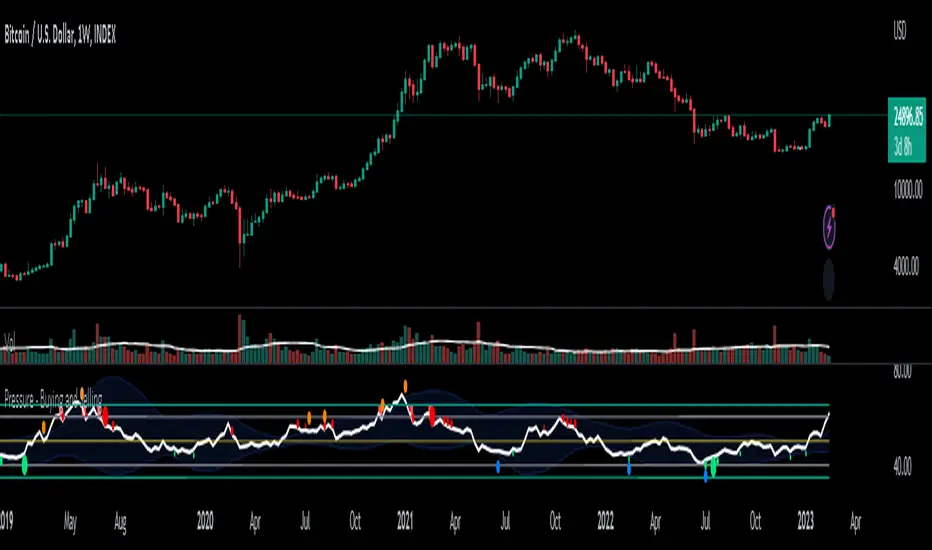
Power Of Stocks - Bollinger Band & 5Ema Indicator - Keanu_RiTz
Power of Stocks - Bollinger band & 5ema Strategy
In this script you get to take Buy/Sell trades using the 3 options mentioned below.(Alerts with price levels for buy/sell at , SL & Target are included in this one)
1. Combined Strategy :- uses confirmation from both strategies to trade.
2. Bollinger band Strategy :- use the Bollinger band Strategy to trade.
3. 5ema Strategy :- use the 5ema Strategy to trade.
1. Combined Strategy :-
for Selling :- we will go short/sell only when conditions of both strategies are satisfied.
i.e. when a candle is completely above the upper Bollinger band & completely above the 5ema then it will be our Alert Candle.
We Short/Sell only when the low of the Alert candle is broken or when the candle closes below the close of the Alert Candle.
SL will be above high of the Alert Candle. Target will be minimum 1:3 or as per your emotions.
for Buying:- we will go Long/Buy only when conditions of both strategies are satisfied.
i.e. when a candle is completely below the lower Bollinger band & completely below the 5ema then it will be our Alert Candle.
We go Long/Buy only when the high of the Alert candle is broken or when the candle closes above the close of the Alert Candle.
SL will be below low of the Alert Candle. Target will be minimum 1:3 or as per your emotions.
2. Power of Stocks - Bollinger Band Strategy :-
Bollinger band with standard deviation = 1.5
when a candle is completely above the upper Bollinger band, that candle will be called a signal/alert candle.
Initiate a Sell trade when that alert candles low is broken. SL will be above high of that alert candle.
Risk to reward ratio will be 1:4 i.e. target will be 4 times the SL.
when a candle is completely below the lower Bollinger band, that candle will be called a signal/alert candle.
Initiate a Buy trade when that alert candles high is broken. SL will be below low of that alert candle.
Risk to reward ratio will be 1:4 i.e. target will be 4 times the SL.
other rules for Options buying:- minimum 15min timeframe
The day you initiate the position , you should be in profit above 10%-15% then only you should carry forward that position overnight, otherwise squareoff your trade on that day only.
Buy ATM or slightly OTM, SL max 100 points , target 1:4
for Long-term/Investing :- Minimum Weekly
If candle is outside the lower band then initiate a Buy trade when that candles High is broken. Sl will be below Low of that candle.
for Long-term Target will be according to your emotions.
3. Power of Stocks - 5ema Strategy (target minimum 1:3)
Timeframe -
5 min for Selling (Sell Futures/index/stocks or buy Put)
15 min for Buying (Buy Futures/index/stocks or sell Put)
for selling stocks :-
you should enter trade within 10am , don't look for entries after that time. take only 2 entries a day.
for selling Index(Banknifty) :-
you can take trade at anytime of the day whenever conditions get satisfied. you can take multiple entries in banknifty as it is very volatile.
for options choose atm strikes: selling trade
sl for premium between 200-300 :- 20-30 points SL
sl for premium between 400-500 :- 40-50 points SL
sl for premium between 500-600 :- 50-60 points SL
Subhashish Pani's (power of stocks) 5 EMA Strategy:-
It plots 5 EMA and Buy/Sell signals with Target & Stoploss levels.
What is Subhashish Pani's (power of stocks) 5 EMA Strategy :-
His strategy is very simple to understand. for intraday use 5 minutes timeframe for selling. You can sell futures, sell call or buy Puts in selling strategy.
What this strategy tries to do is , it tries to catch the tops, so when you sell at top & it turns out to be a reversal point then you can get good profit.
this will hit stop losses often, but stop losses are small and minimum target should be 1:3. but if you stay with the trend you can get big profits.
According to Subhashish Pani this strategy has 60% success rate.
Strategy for Selling (Short future/Call/stock or buy Put)
When ever a Candle closes completely above 5 ema (no part of candle should be touching the 5ema), then that candle should be considered as Alert Candle.
If the next candle is also completely above 5 ema and it has not broken the low of previous alert candle, Then the previous Alert Candle should be ignored and the new candle should be considered as new Alert Candle.
so if this goes on then continue shifting the Alert Candle, but whenever the next candle breaks the low of the Alert Candle we should take the Short trade (Short future/Call/stock or buy Put).
Stoploss will be above high of the Alert Candle and minimum target will be 1:3.
Strategy for Buying (Buy future/Call/stock or sell Put)
When ever a Candle closes completely below 5 ema (no part of candle should be touching the 5ema), then that candle should be considered as Alert Candle.
If the next candle is also completely below 5 ema and it has not broken the high of previous alert candle, Then the previous Alert Candle should be ignored and the new candle should be considered as new Alert Candle.
so if this goes on then continue shifting the Alert Candle, but whenever the next candle breaks the high of the Alert Candle we should take the Long trade (Buy future/Call/stock or sell Put).
Stoploss will be below low of the Alert Candle and minimum target will be 1:3.
Buy/Sell with extra conditions :
it just adds 1 more condition to buying/selling
1. checks if closing of current candle is lower than alert candles closing for Selling & checks if closing of current candle is higher than alert candles closing for Buyling.
This can sometimes save you from false moves but by using this, you can also miss out on big moves as you'll enter trade after candle closing instead of entering at break of high/low.
Note :- According to Subhashish Pani Timeframe for intraday buying should be 15 minutes Timeframe.
If you haven't understood the strategy by reading above description, then search for "Subhashish Pani's (power of stocks) 5 EMA Strategy" on YouTube to get a deeper understanding.
Note:- This is not only for Intraday trading , you can use this strategy for Positional/Swing trading as well. If you use this on Monthly Timeframe then it can be very good for Long Term Investing as well.
Rules will be same for all types of trades & Timeframes.

PowerOfStocks_5EMAThis indicator is based of Subhashish Pani's (power of stocks) 5 EMA Strategy.
It plots 5 EMA and Buy/Sell signals with Target & Stoploss levels.
What is Subhashish Pani's (power of stocks) 5 EMA Strategy :-
His strategy is very simple to understand. for intraday use 5 minutes timeframe for selling. You can sell futures, sell call or buy Puts in selling strategy.
What this strategy tries to do is , it tries to catch the tops, so when you sell at top & it turns out to be a reversal point then you can get good profit.
this will hit stop losses often, but stop losses are small and minimum target should be 1:3. but if you stay with the trend you can get big profits.
According to Subhashish Pani this strategy has 60% success rate.
Strategy for Selling (Short future/Call/stock or buy Put)
When ever a Candle closes completely above 5 ema (no part of candle should be touching the 5ema), then that candle should be considered as Alert Candle.
If the next candle is also completely above 5 ema and it has not broken the low of previous alert candle, Then the previous Alert Candle should be ignored and the new candle should be considered as new Alert Candle.
so if this goes on then continue shifting the Alert Candle, but whenever the next candle breaks the low of the Alert Candle we should take the Short trade (Short future/Call/stock or buy Put).
Stoploss will be above high of the Alert Candle and minimum target will be 1:3.
Strategy for Buying (Buy future/Call/stock or sell Put)
When ever a Candle closes completely below 5 ema (no part of candle should be touching the 5ema), then that candle should be considered as Alert Candle.
If the next candle is also completely below 5 ema and it has not broken the high of previous alert candle, Then the previous Alert Candle should be ignored and the new candle should be considered as new Alert Candle.
so if this goes on then continue shifting the Alert Candle, but whenever the next candle breaks the high of the Alert Candle we should take the Long trade (Buy future/Call/stock or sell Put).
Stoploss will be below low of the Alert Candle and minimum target will be 1:3.
Buy/Sell with extra conditions :
it just adds 1 more condition to buying/selling
1. checks if closing of current candle is lower than alert candles closing for Selling & checks if closing of current candle is higher than alert candles closing for Buyling.
This can sometimes save you from false moves but by using this, you can also miss out on big moves as you'll enter trade after candle closing instead of entering at break of high/low.
Note :- According to Subhashish Pani Timeframe for intraday buying should be 15 minutes Timeframe.
If you haven't understood the strategy by reading above description, then search for "Subhashish Pani's (power of stocks) 5 EMA Strategy" on youtube to get a deeper understanding.
Note:- This is not only for Intraday trading , you can use this strategy for Positional/Swing trading as well. If you use this on Monthly Timeframe then it can be very good for Long Term Investing as well.
Rules will be same for all types of trades & Timeframes.
TriexDev - SuperBuySellTrend (PLUS+)Minimal but powerful.
Have been using this for myself, so thought it would be nice to share publicly. Of course no script is correct 100% of the time, but this is one of if not the best in my basic tools. (This is the expanded/PLUS version)
Github Link for latest/most detailed + tidier documentation
Base Indicator - Script Link
TriexDev - SuperBuySellTrend (SBST+) TradingView Trend Indicator
---
SBST Plus+
Using the "plus" version is optional, if you only want the buy/sell signals - use the "base" version.
## What are vector candles?
Vector Candles (inspired to add from TradersReality/MT4) are candles that are colour coded to indicate higher volumes, and likely flip points / direction changes, or confirmations.
These are based off of PVSRA (Price, Volume, Support, Resistance Analysis).
You can also override the currency that this runs off of, including multiple ones - however adding more may slow things down.
PVSRA - From MT4 source:
Situation "Climax"
Bars with volume >= 200% of the average volume of the 10 previous chart TFs, and bars
where the product of candle spread x candle volume is >= the highest for the 10 previous
chart time TFs.
Default Colours: Bull bars are green and bear bars are red.
Situation "Volume Rising Above Average"
Bars with volume >= 150% of the average volume of the 10 previous chart TFs.
Default Colours: Bull bars are blue and bear are blue-violet.
A blue or purple bar can mean the chart has reached a top or bottom.
High volume bars during a movement can indicate a big movement is coming - or a top/bottom if bulls/bears are unable to break that point - or the volume direction has flipped.
This can also just be a healthy short term movement in the opposite direction - but at times sets obvious trend shifts.
## Volume Tracking
You can shift-click any candle to get the volume of that candle (in the pair token/stock), if you click and drag - you will see the volume for that range.
## Bollinger Bands
Bollinger Bands can be enabled in the settings via the toggle.
Bollinger Bands are designed to discover opportunities that give investors a higher probability of properly identifying when an asset is oversold (bottom lines) or overbought (top lines).
>There are three lines that compose Bollinger Bands: A simple moving average (middle band) and an upper and lower band.
>The upper and lower bands are typically 2 standard deviations +/- from a 20-day simple moving average, but they can be modified.
---
Base Indicator
## What is ATR?
The average true range (ATR) is a technical analysis indicator, which measures market volatility by decomposing the entire range of an asset price for that period.
The true range indicator is taken as the greatest of the following:
- current high - the current low;
- the absolute value of the current high - the previous close;
- and the absolute value of the current low - the previous close.
The ATR is then a moving average, generally using 10/14 days, of the true ranges.
## What does this indicator do?
Uses the ATR and multipliers to help you predict price volatility, ranges and trend direction.
> The buy and sell signals are generated when the indicator starts
plotting either on top of the closing price or below the closing price. A buy signal is generated when the ‘Supertrend’ closes above the price and a sell signal is generated when it closes below the closing price.
> It also suggests that the trend is shifting from descending mode to ascending mode. Contrary to this, when a ‘Supertrend’ closes above the price, it generates a sell signal as the colour of the indicator changes into red.
> A ‘Supertrend’ indicator can be used on equities, futures or forex, or even crypto markets and also on daily, weekly and hourly charts as well, but generally, it will be less effective in a sideways-moving market.
Thanks to KivancOzbilgic who made the original SuperTrend Indicator this was based off
---
## Usage Notes
Two indicators will appear, the default ATR multipliers are already set for what I believe to be perfect for this particular (double indicator) strategy.
If you want to break it yourself (I couldn't find anything that tested more accurately myself), you can do so in the settings once you have added the indicator.
Basic rundown:
- A single Buy/Sell indicator in the dim colour; may be setting a direction change, or just healthy movement.
- When the brighter Buy/Sell indicator appears; it often means that a change in direction (uptrend or downtrend) is confirmed.
---
You can see here, there was a (brighter) green indicator which flipped down then up into a (brighter) red sell indicator which set the downtrend. At the end it looks like it may be starting to break the downtrend - as the price is hitting the trend line. (Would watch for whether it holds above or drops below at that point)
Another example, showing how sometimes it can still be correct but take some time to play out - with some arrow indicators.
Typically I would also look at oscillators, RSI and other things to confirm - but here it held above the trend lines nicely, so it appeared to be rather obvious.
It's worth paying attention to the trend lines and where the candles are sitting.
Once you understand/get a feel for the basics of how it works - it can become a very useful tool in your trading arsenal.
Also works for traditional markets & commodities etc in the same way / using the same ATR multipliers, however of course crypto generally has bigger moves.
---
You can use this and other indicators to confirm likeliness of a direction change prior to the brighter/confirmation one appearing - but just going by the 2nd(brighter) indicators, I have found it to be surprisingly accurate.
Tends to work well on virtually all timeframes, but personally prefer to use it on 5min,15min,1hr, 4hr, daily, weekly. Will still work for shorter/other timeframes, but may be more accurate on mid ones.
---
This will likely be updated as I go / find useful additions that don't convolute things. The base indicator may be updated with some limited / toggle-able features in future also.

[VC] Cumulative Delta Histogram V1.0The V.C Cumulative Delta Histogram shows the market's ongoing Buying/Selling pressure. It helps to determine whether Supply or Demand is dominating and in control.
➤If the Cumulative Delta Increases, the buyers are in control.➚
➤If the Cumulative Delta Decreases, the sellers are in control.➘
The use cases for this Indicator are vast and correlated with our other Delta Indicators. The following examples will explain how to use this Indicator.
Example 1 EUR / USD
In the above example, Negative Cumulative Delta Decreased & Turned into Positive Cumulative Delta. That indicates that sellers are losing control & buyers are getting power.
As a confirmation on the ' 'Box Chart Histogram'' it is evident that Demand is also increasing.
And on ''Wave Chart Index'' as a 3rd confirmation, you can see that the Delta has also increased compared to previous waves.
Example 2
Positive Delta on Cumulative Delta Histogram is decreasing & Negative Delta started increasing.
On the Box Chart Histogram , Demand is decreasing & Supply is increasing.
Additionally, on the Wave Chart Index , the Delta of the wave is also decreasing.
(in short, besides ''Cumulative Delta Histogram," Box chart Histogram & Wave Chart Index is also adding additional confirmation)
Note: Two types of Delta sources are included in this Cumulative Delta Indicator.
Type A: Simple Delta
Type B: Delta %
Simple Delta is the difference between Net Buying - Selling pressure.
Delta % also works in the same calculation, but a Volume weighted algorithm is applied on it.
You may use any of them that suits your analysis.
VC Cumulative Delta Histogram Settings & Inputs
Source:
Allows you to choose the source, Between Simple Delta & Delta %.
Cumulative Length:
Allows you to Change the cumulative length.
Positive & Negative Color:
It allows you to change the colors.
Style Menue
Allows you to change the style & color of the histogram.
Disclaimer Note:
V.C Cumulative Delta Histogram It is purely Volume , Delta, Demand & Supply imbalance and comparative analysis-based tool. Before applying this Indicator to your study, you should know about Volume , Delta & Spread, Demand & Supply, and Aggressive & Passive behaviour of buyers/sellers.
Some basic understanding of Sir Richerd Wyckoff's Theory can also be helpful.

Rebalance as a Bear/Bull indicatorCheck if the current market has a Bear tendency or a Bull tendency.
Bear areas are marked as red squares going down from 0.
Bull areas are marked as green squares going up from 0.
Buying/Selling windows of opportunity
On top of the Bear/Bull squares, this indicator tries to show you the windows where to look for good buying/selling opportunities.
These are marked as full columns:
Blue columns represent a window to look out for good buying opportunities
Pink columns represent a window to look out for good selling opportunities
How is this possible?
This is an indicator of a simple idea to check if the market has a Bear or Bull tendency:
1. Start with a virtual portfolio of 60/40 tokens per fiat.
2. Rebalance it when its ratio oscillates by a given % (first input)
3. Count the number of times the rebalancer buys, and sells
4. When the number of buys is greater than the number of sells => the market is going down
5. When the number of sells is greater than the number of buys => the market is going up
This is shown as the "Bear/Bull Strength" squares (red when bear, green when bull)
An extra rebalancer is also kept that works at each bar (regardless of the input %).
This is used to calculate an amount of tokens beying sold/bought and used as a "market force" coefficient.
Another extra: based on both the bear/bull strengh and market force an attempt is made to
provide good buying/selling windows of analysis.
The blue background is a buying opportunity, the red background is a sell opportunity.
In a bear market sales are delayed, and in a bull market buys are delayed.

Hunt Bitcoin CoT Buy/Sell signalWhy Bother another CoT signal?
Its different & focused on the Insider's.
Performance -
This Indicator provided a
1. Signal 1 = 26th March 2019 = SUPER LONG at $4,500 that saw a near $14,000 run up
2. Signal 2 = 18th & 24th June 2019 = SHORT at the second & final level $11,700 after repeated attempts & failure in the $13K range, the mini Echo Bitcoin Bull of 2019
3. Signal 3 = 17th December 2019 = LONG $6,900, Bitcoin rallied to Mid $10,500's
4. Signal 4 = 18th Feb 2020 = SUPER SHORT from $9,700's to a final extreme Low of $3,000, calling the CV-19 collapse
5. Signal 5 = 17th March 2020 = LONG from $5,400 no closure point yet
6. Signal 6 = 29th June 2020 = SUPER LONG reiterate from $10,700 no closure sell signal yet
7. Signal 7 = 17th May 2020 = LONG another accumulate LONG with no sell signal yet generated at Post H&S's low of $33,000
Note - This indicator only commences March 2019, as Bitcoin futures were a recent introduction and needed to settle for 6 months in both use and data, no signals were meaningful prior & data was light.
What is Provided. - Please note the need to also add the Hunt Bitcoin Historical Volatility Indicator for full understanding.
We provide 3 things with the 3 indicators.
'Insider' indications from Largest players in the futures market.
1. Bitcoin Macro Buy Signals.
a) The Bitcoin Commitment of Traders results see us focus solely on Largest 4 Short Open Interest & Largest 4 Long Open Interest aspects of the CoT Release data.
When the difference - is tight, a kind of pinch, these have been great Buy signals in Bitcoin.
We call this difference the Delta & When Delta is 5% or less Bitcoin is a Buy.
2. Bitcoin Macro Sells.
a) A sell signal is Triggered in Bitcoin at any point the Largest 4 short OI > or = to 70
3. AMPLIFIER Trade signals 'Super' Longs or Shorts -
Extreme low volatility events leads to highly impulsive & volatile subsequent moves, if either of 1 or 2 above occur, combined with extreme low volatility
a 'Super Long' or 'SUPER SELL' is generated. In the case of the short side, given Bitcoins general expansive and MACRO Bull trend since inception, we seek an additional component
that is an extreme differential/Delta reading between 4 biggest Longs & Shorts OI.
Namely CoT Delta also must be > 47.5%
We also have a Cautionary level, where it is not necessarily a good idea to accumulate Bitcon, as a better opportunity lower may avail itself, see conditions below.
So the required logic explicitly stated below for all Signals.
1. Long - Hunt Bitcoin CoT Delta < or = 5
2. SUPER Long - Hunt Bitcoin CoT Delta < or = 5; and 2 Day Historical Bitcoin Volatility = or < 20
3. Short - Largest 4 Sellers OI = or > 70
4. SUPER Short - Largest 4 Sellers OI = or > 70; AND..
Hunt Bitcoin CoT Delta = or > 47.5 AND 2 Day Historical BTC Volatility = or < 20
5. Caution - Largest 4 Sellers OI = or > 67.5 AND Hunt Bitcoin CoT Delta = or > 45
WARNING SEE Notes Below
Note 1 - = Largest 4 Open Interest Shorts
Note 2 - = Largest 4 Open Interest Longs
Note 3 - = Hunt Cot Delta = (Largest 4 sellers OI) -( Largest 4 Buyers OI)
Caution = Avoid new Bitcoin Accumulation Right Now, A sell signal might follow Enter on next Long
Note 4 - The Hunt Bitcoin COT Delta signal is a Largest 'Insider' Tracking tool based on a segment of Commitment of Traders data on Bitcoin Futures, released once a week on a Friday.
It is a Macro Timeframe signal , and should not be used for Day trading and Short Timeframe analysis , Entries may be optimised after a Hunt Bitcoin CoT Signal is generated by separate shorter Timeframe analysis.
Note 5 - The Historical Bitcoin Volatility is an additional 'Amplifier' component to the 'Hunt Bitcoin Cot Delta' Insider Signal
Note 6 - The Historical Bitcoin Volatility criteria varies by timeframe, the above levels are those applying on a Two Day TF Chart, select this custom timeframe in Trading View.
if additional criteria are met for LONG & SHORT insider signals, they may become 'Super Longs/Shorts', see conditions box above.

MRP WEEKLY LEVELIntraday Indicator: #MRP_WEEKLY_LEVEL
This indicator plots support and resistance levels based on fibonnaci levels for the entire week.
1. Understanding The Levels:
Intermediate Zone is two pink coloured lines.
Resistance is two blue coloured lines above intermdiate zone.
Support is two blue coloured lines below intermediate zone.
Buy target and Sell Target 1 & 2 are yellow and red coloured lines on both sides.
-Price is strong when it is above the Intermediate Zone.
-Price is weak when it is below the Intermediate Zone.
-Price remains range bound when it stays inside the Intermediate Zone.
-Price is very strong when it's above Weeky Resistance Zone
-Price is very weak when it's below Weekly Support Zone
-Buy Target & Sell Target are the zones where you should take or trail your profit.
2.For Buying/Selling:
-Buy only when 30min close above Resistance Zone . SL below Resistance Zone .
-If 30min close is in huge range, you can buy/sell after pullback to Resistance/ Support Zone .
-Also you can buy/sell if 30min close is above/below Buy/Sell target zone if you missed the rally.
-Sell only when the 30min close below Support Zone . SL above Support Zone .

MRP_DAILY_LEVELIntraday Indicator: #MRP_DAILY_LEVEL
This indicator plots support and resistance levels based on fibonnaci levels.
1. Understanding The Levels:
Intermediate Zone is two brown coloured lines.
Resistance is two red coloured lines.
Support is two green coloured lines.
Buy target and Sell Target are white coloured lines on both sides.
-Price is strong when it is above the Intermediate Zone.
-Price is weak when it is below the Intermediate Zone.
-Price remains range bound when it stays inside the Intermediate Zone.
-Price is very strong when it's above Resistance Zone
-Price is very weak when it's below Support Zone
-Buy Target & Sell Target are the zones where you should take or trail your profit.
2.For Buying/Selling:
-Buy only when 15min close above Resistance Zone. SL below Resistance Zone.
-If 15min close is in huge range, you can buy/sell after pullback to Resistance/Support Zone.
-Also you can buy/sell if 15min close is above/below Buy/Sell target zone if you missed the rally.
-Sell only when the 15min close below Support Zone. SL above Support Zone.

FlipSignalsFlipSignals is a TradingView indicator designed to help you make smarter, more efficient trading decisions by simplifying your trading. Specific symbols show up directly on price action to help you easily visualize trade setups and interpret market movement. The framework behind FlipSignals is systematic yet simple: First, establish a dominant trend with the Trend Level. Then, identify optimal entry points. With a complete understanding of FlipSignals you'll be able to confidently interpret and navigate any market with strong conviction.
Trend Level
The Trend Level is the step line that runs through price action and establishes a dominant directional trend, either green or red. When the Trend Level is green, buyers are in control and price action is bullish - suggesting buying pressure and higher prices. Conversely, when the Trend Level is red, sellers are in control and price action is bearish - suggesting selling pressure and lower prices.
During an uptrend, price action will trade above the Trend Level and use the Trend Level as support. Conversely in a downtrend, price action will trade below the Trend Level, which will act as resistance. When the Trend Level flat lines and flips from one color to another, this signals that price action is resting and could potentially indicate that the trend is shifting or consolidating for a continuation move.
The Trend Level can also be used as a trail stop level when you are in a position. For example, if you are long when the Trend Level is green and stair stepping higher, you can incrementally place your stop right below the Trend Level as price action increases in order to protect your unrealized profit.
Momentum Shifts - ShiftUp / ShiftDown
Small blue and orange triangles indicate short term momentum shifts in price action. When momentum shifts upwards, a small blue up triangle will appear below the candle and when momentum shifts downwards, a small orange, down triangle will appear above the candle.
ShiftUp and ShiftDown signals generally confirm short term tops/bottoms although consecutive momentum shifts within a short period of candles can indicate consolidation and stalled price action.
Buy/Sell XOB/XOS Levels
FlipSignals’ algorithm calculates a sentiment score that measures the net buying and selling in any given market. This score oscillates above and below zero identifying extended buying and selling pressure. A positive score indicates that buyers are in control whereas a negative score signals that sellers are in control.
FlipSignals generates buy and sell level Dot Clusters and Extreme Overbought/Oversold (XOB/XOS) symbols based on the sentiment score to easily visualize overextended buying or selling directly on price action candles.
Dot Clusters - Buy/Sell Levels
FlipSignals allows users to set 3 buy and 3 sell levels to determine when dot clusters will appear. Dot clusters will appear when sentiment score breaches each level.
Buy level dot clusters will appear below candles indicated by yellow and green circles, while sell level dot clusters will appear as yellow and red circles above candles.
Generally, dot clusters indicate that price action is extended one way or the other. Notice that buy dot clusters appear below the Trend Level while sell dot clusters appear above the Trend Level for the majority of the time.
Extreme Overbought/Oversold Signal
Extreme Overbought (XOB) signals will appear as neon green X's above the candle indicating price action has entered extreme overbought levels. Typically, XOB signals serve as a warning that prices could continue higher.
Extreme Oversold (XOS) signals will appear as red X's below the candle indicating price action has entered extreme oversold levels. Typically, XOS signals serve as a warning that prices could continue lower.
Generally, sentiment scores of +/-4 are considered extreme readings although this can vary by asset. User defined inputs of buy/sell and XOB/XOS levels determine when signals will appear.
Additional Support/Resistance Indicators Include:
VWAP
3 EMAs
3 SMAs
Weekly Pivot Points
Monthly Pivot Points
Quarterly Pivot Points
Previous Day OHLC
Please use the link below to our website to obtain access to this indicator.

Jackrabbit.modulus.TrailingThis is a full, true, and pure implementation of trailing buy/sell for the Jackrabbit suite and modulus framework.
This module is not a standalone and relies on previous modules to send a signal data in order to function properly. This module acts on buy and sell data from within the indicator on indicator framework that TradingView supports.
This module adds the ability to trail a buying position to its lowest value or if it breaks a retracement percentage (user defined). It also allows trailing a sell position with an user defined retracement. It can managing buy and selling or just buying or selling.
This module does NOT allow accumulation during the trailing process. If a buy signal is received while the module is already trailing a previous position, if the price is lower then the previous position, the current position is used, otherwise it is ignored. The same holds true for selling. Once the position is bought, accumulation will resume as normal for the next position.
The chart displays (for both buying and selling):
The current price, its retracement value, and the original price.
Note that the buy or sell does NOT actually take place until the price action crosses retracement.
The Jackrabbit modulus framework is a plug in play paradigm built to operate through TradingView's indicator on indicatior (IoI) functionality. As such, this script receives a signal line from the previous script in the IoI chain, and evaluates the buy/sell signals appropriate to the current analysis.
This script is by invitation only. To learn more about accessing this script, please see my signature or send me a PM. Thank you.
auto trend lines with buy sell signalKalakar trader's Tools is the tool where Buy and sell signals generates automatically according to the candles behavior.
It automatically made trend line
It as build in moving average also
It uses WD Gann Levels to calculate entry point with the help of VWAP .
Pivot points determines the recent support and resistance levels.
Trading rule for this indicator
This indicator is designed for Indian equity stocks
Best performance is expected on 10 minutes chart basic user can use 5 minutes chart for stock value less than 500 rupees, else 15 minutes chart
Plotted line shows the market sentiment, green for buy, red for sell and black for neutral market.
Order thumb rule
For buy signals there is a up triangle in green color
For sell signal there is a down triangle in red color
1. avoid any trade signal before 9:35 AM Indian time
2. signal and related stop loss candle must be formed in the same day
3. if order placed in 5 minutes chart then don't go for a target of 15 minutes chart
4. if order placed in 15 minutes time frame and target is too far then check the target in 5 minutes time frame
5. if signal candle touches the target then avoid the signal.
6. Money management is most important for this indicator.
7. Take trade only if it satisfy risk reward ratio.
8. It has long target but need patience.
Signal
using vwap calculates gann square of 9 levels and if any smart money activity on that level then checks the confirmation of the trend by higherhigh or lowerlow formation
Buy Entry : entry price should be on the high of the candle before signal for buy and sl on bottom of flagged candle just before signal
SellEntry : entry price should be on the low of the candle before signal for sell and sl on top of flagged candle just before signal
Please add some extra value to the Stop Loss for safe trading
Warning : Don't place any order without stop loss, This tool is made for educational and learning purpose only, take any trade at your own risk.